Figure 4.

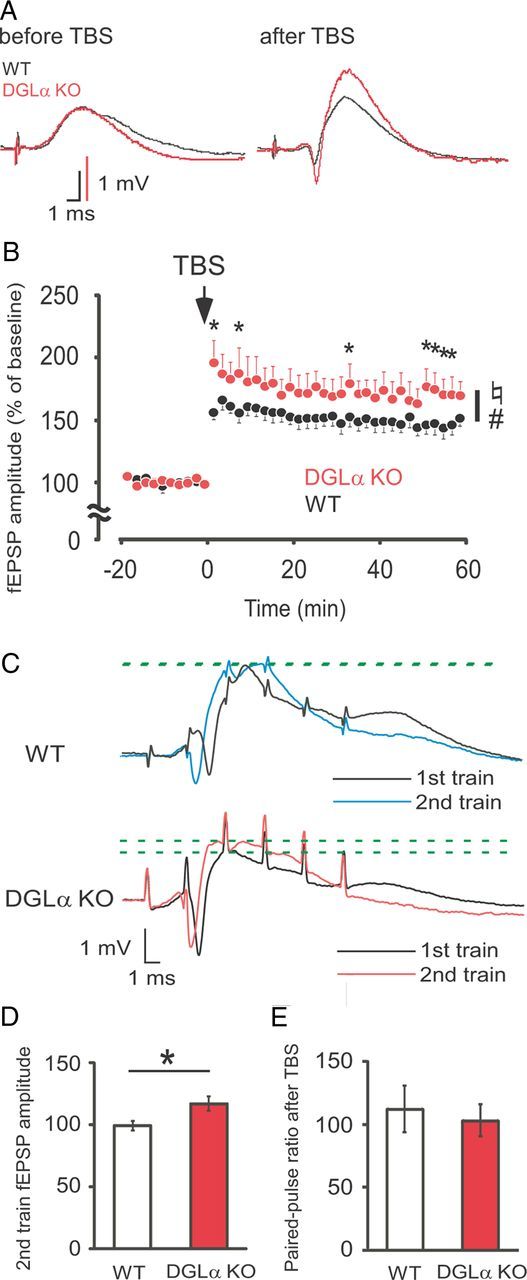
Enhanced LTP and elevated excitability during TBS in freely moving DGLα knock-out (KO) mice. A, Sample traces of the evoked dentate field potentials before (left) and 60 min after (right) TBS recorded from a DGLα KO and a wild-type (WT) mouse. Scale bars: 1 mV, 1 ms. B, Time courses of evoked fEPSP amplitude in the dentate gyrus are expressed in percentage of mean fEPSP amplitudes during baseline recording in DGLα KO (n = 7) and WT (n = 9) mice before and after TBS (arrow). Error bars indicate means ± SEM. ♮p < 0.05 for the effect of genotype, #p < 0.05 for the interaction between genotype and time in two-way ANOVA, and *p < 0.05 in Tukey's test. C, Sample traces of the evoked dentate field potentials during the first six stimuli of the first (black) and second (colored) trains of TBS in a WT (top traces) and a DGLα KO (bottom traces) mouse. Green dotted lines indicate the peak of fEPSP. D, Evoked fEPSP amplitude of the first six stimuli of the second train of TBS relative to that of the first train in DGLα KO (n = 7) and WT (n = 9) mice. E, Paired-pulse ratios 60 min after TBS are expressed as percentage of the paired-pulse ratio before TBS in DGLα KO (n = 5) and WT (n = 5) mice. Error bars indicate means ± SEM. *p < 0.05, t test.
