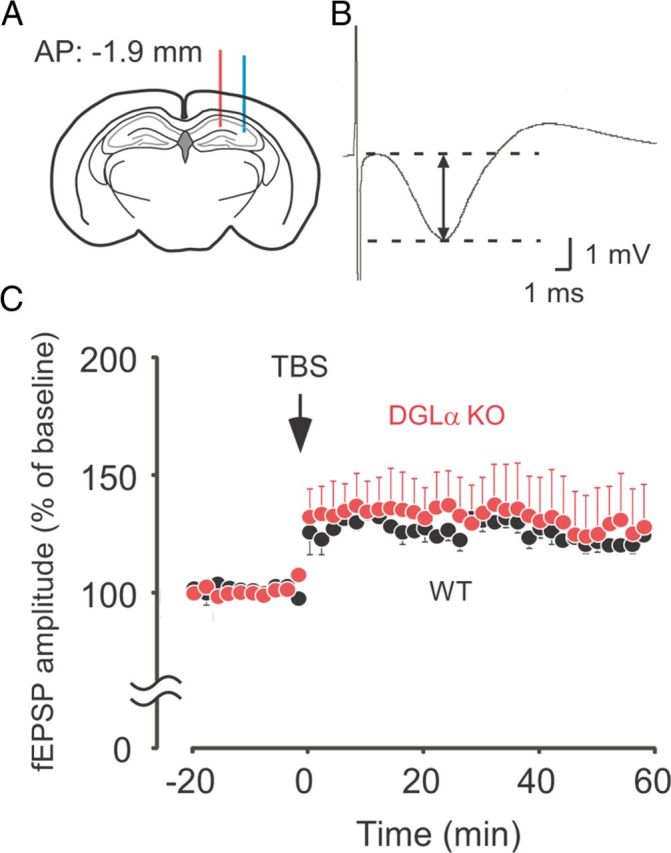
Figure 5.

Lack of significant changes in LTP at Schaffer collateral–CA1 pyramidal cell synapses in freely moving DGLα knock-out (KO) mice. A, A schematic diagram showing the positions of recording (red line) and stimulation electrodes (blue line). B, Sample trace of the hippocampal CA1 field potentials evoked by Schaffer collateral stimulation and recorded from the CA1 molecular layer of a wild-type (WT) mouse. Amplitude of fEPSP is indicated as arrows with solid line. C, Time courses of evoked fEPSP amplitude in the hippocampal CA1 are expressed in percentage of mean fEPSP amplitudes obtained during baseline recording period (20 min) before TBS (arrow) in DGLα KO (n = 5) and WT (n = 6) mice. Error bars indicate means ± SEM.
