Figure 4.
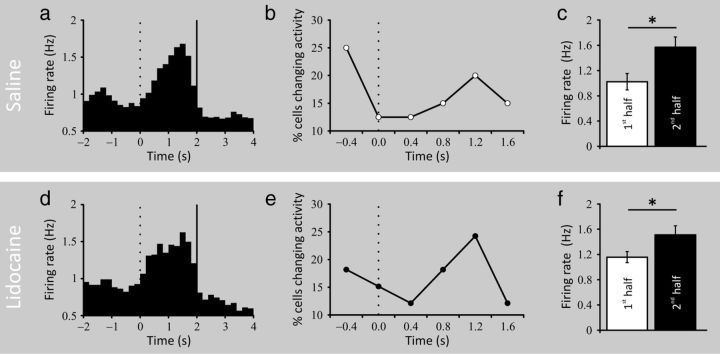
Characteristics of population activity during the goal period. a, Smoothed cumulative PETH for place cells showing goal-related firing in the saline condition (n = 22). The 2 s goal period (0–2 s) is bracketed by vertical lines (200 ms bins). Goal zone entry is at t = 0 s (vertical dotted line) and food dispenser activation is at t = 2 s (vertical black line). The activity of each cell was normalized before summation was done over the sample. Note that the mean peak activity is delayed ∼1 s after goal arrival. b, Percentage of cells whose activity showed the greatest increase at different times during the goal period of the place task. Entry into the goal zone is at t = 0 s. The delay suggested in the average of the cumulative PETH is seen here as a rise near the middle of the goal period. c, Bar graph showing significant differences in firing rate between the first half and the second half of the delay period (*p < 0.05). d, Smoothed PETH (same convention as in a) for place cells showing goal-related firing in lidocaine condition. Although broader in shape, the goal firing activity is still present when the prefrontal cortex is inactivated and its dynamic is unaltered as can be seen in e (same convention as in b). f, Significant differences in firing rate between the two halves of the delay period are still present under prefrontal inactivation (*p < 0.05).

