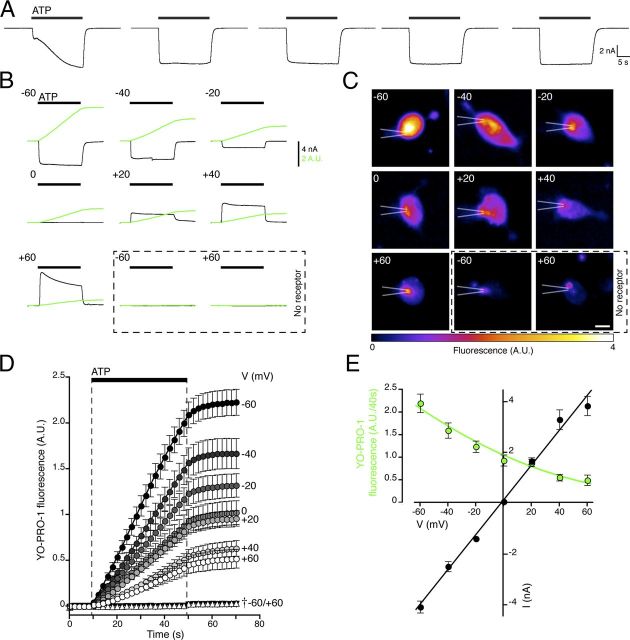
Figure 1.
Simultaneous measurement of membrane current and dye influx. A, An initial application of ATP (5 mm) evoked a current with a biphasic increase in amplitude, and subsequent applications gave reproducible responses. Agonist was applied for 20 s at 2 min intervals. B, Representative recordings of wild-type P2X7 receptor ionic current (black) and cumulative YO-PRO-1 fluorescence (green) measured simultaneously, with ATP (5 mm) applied for 40 s (bar). Cells were held at the indicated membrane potentials (mV). C, Cell fluorescence imaged at 40 s, at several membrane potentials. The position of the recording pipette is indicated. Scale bar, 10 μm. Bottom right panels show mock-transfected cells. D, Time course of YO-PRO-1 fluorescence shows that its influx is reduced at more positive membrane potentials. †Control cells not expressing P2X7 receptors. E, Current–voltage plots for ATP-evoked currents and YO-PRO-1 influx (rate of change of cumulative YO-PRO-1 signal). The fluorescence–voltage relationship is fit to a unidirectional influx equation of the form y = A*V*{exp(−BV)/(1 − exp(−BV)}, where V is the membrane potential, and A and B are constants. Cells were stably expressing the P2X7 receptor. Error bars indicate the SE of the mean for 9–12 cells in each case.

