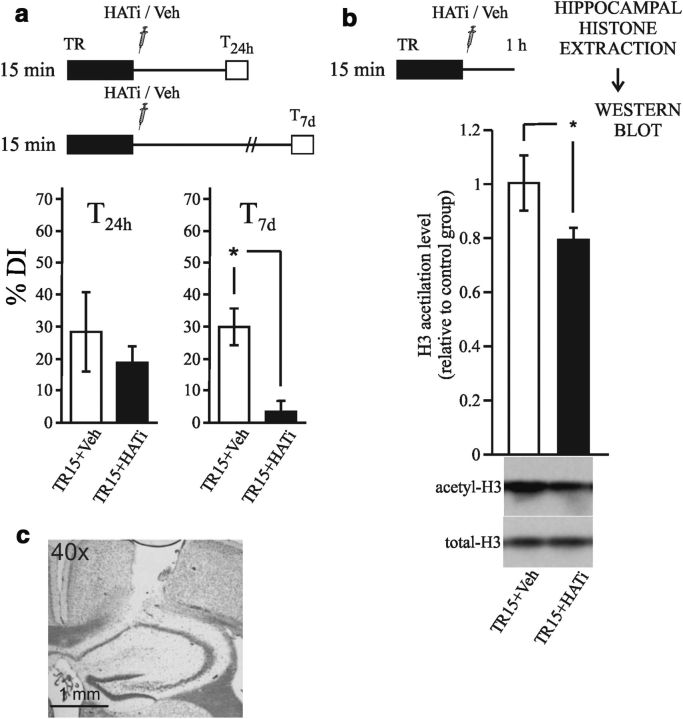
Figure 2.
Administration of a HAT inhibitor in the hippocampus impairs long-lasting recognition memory and the histone acetylation increment during consolidation. a, Diagram outlining the experimental design. Left: Mean ± SEM of DI% for the 24 h test of the TR15+HATi (n = 11) and TR15+Veh (n = 6) groups. Right: Mean ± SEM of DI% for the 7 d test of the TR15+HATi (n = 8) and TR15+Veh groups (n = 9). **p < 0.01, Student's t test. b, Diagram outlining the experimental design. Animals were killed 1 h after training (n = 6 per group). Graph represents the mean ± SEM of acetyl H3 levels in hippocampus estimated by Western blot normalized to total H3 levels. *p < 0.05 Student's t test. c, Example of cannula position (cresyl violet stained).

