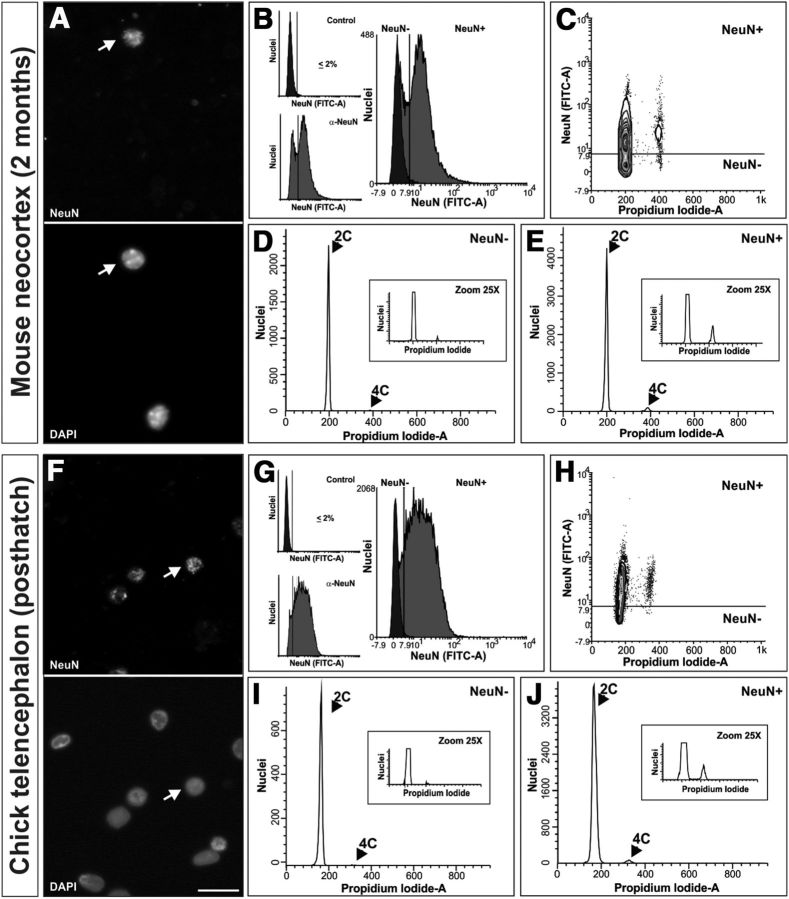
Figure 2.
Somatic tetraploid neurons in the mouse cerebral cortex and chick telencephalon. A, Cell nuclei isolated from the cerebral cortex of 2-month-old mice immunostained with an anti-NeuN-specific antibody and counterstained with DAPI. Arrow, An NeuN-positive nucleus. B, Cell nuclei immunostained with the anti-NeuN antibody (α-NeuN) or with the secondary antibody alone (Control) were PI stained and subjected to flow cytometric analysis. Right, Illustrates the threshold used for the discrimination of NeuN-positive nuclei. C, DNA content (Propidium Iodide-A) plotted against NeuN signal intensity (FITC-A) demonstrates that most nuclei with 4C content are positive for NeuN immunolabeling. D, DNA content histogram from NeuN-negative nuclei. E, DNA content histogram from NeuN-positive nuclei. See Table 1 for quantitative data. F, Cell nuclei isolated from the telencephalon of posthatch chicks immunostained with an anti-NeuN-specific antibody and counterstained with DAPI. Arrow, An NeuN-positive nucleus. G, Cell nuclei immunostained with the anti-NeuN antibody (α-NeuN) or with the secondary antibody alone (Control) were PI stained and subjected to flow cytometric analysis. Right, Illustrates the threshold used for the discrimination of NeuN-positive nuclei. H, DNA content (Propidium Iodide-A) plotted against NeuN signal intensity (FITC-A) demonstrates that most nuclei with 4C content are positive for NeuN immunolabeling. I, DNA content histogram from NeuN-negative nuclei. J, DNA content histogram from NeuN-positive nuclei. See Table 1 for quantitative data. Scale bar, 20 μm.

