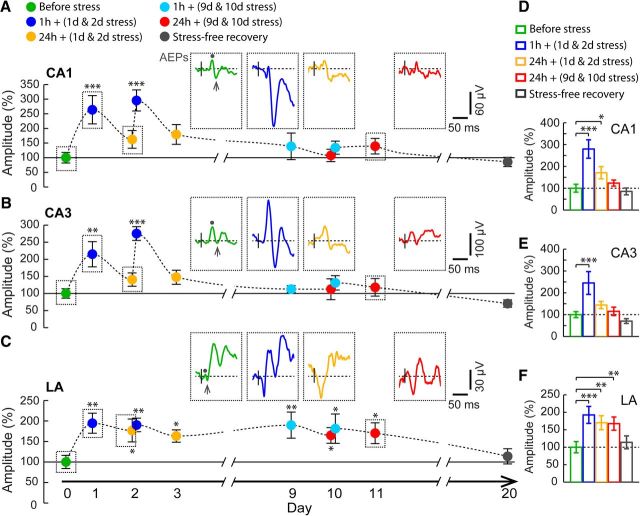
Figure 2.
Contrasting effects of chronic stress on AEPs in the hippocampus and amygdala. A–C, Time course of changes in mean amplitude of AEPs (n = 7), normalized to pre-stress baseline values, recorded in CA1 (A), CA3 (B), and LA (C). Insets, Representative AEP traces recorded in all three areas before stress (green), 1 h (blue) and 24 h (orange) after the first day of chronic stress, and 24 h (red) after the 10th day of chronic stress. AEP amplitudes were quantified by measuring the difference of the peak negative deflection (arrow) relative to first positive peak (dot). Stress significantly enhanced AEP amplitudes in CA1, CA3, and LA 1 h after the first and second days of stress but differed in their temporal persistence with repeated exposure. D–F, Mean AEP amplitudes (n = 7) compared across five blocks of time, as depicted in Figure 1A (see Materials and Methods). In areas CA1 (D) and CA3 (E), AEPs were enhanced only during the early stages of chronic stress. In contrast, LA (F) exhibited a persistent increase for all 10 d. Error bars indicate ±SEM. *p < 0.05, **p < 0.01, ***p < 0.001.

