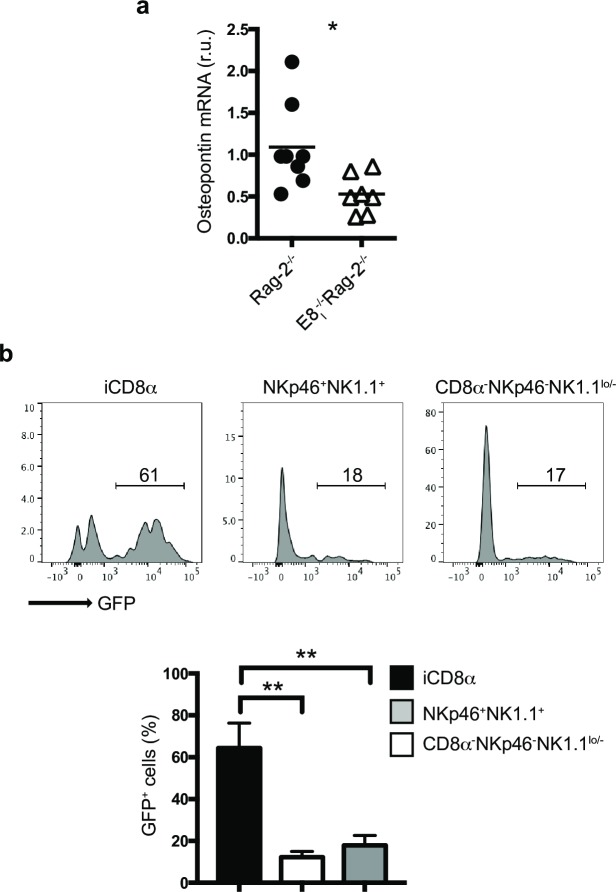
Fig 2. Osteopontin expression in the IEL compartment is primarily associated with iCD8α cells.
(a) Osteopontin mRNA expression in the intestine of the indicated mice. Expression levels in E8I-/-Rag-2-/- mice were compared to the average expression levels observed in Rag-2-/- mice. Each symbol represents an individual mouse (n = 7 to 8). Data are the combination of two independent experiments. (b) Osteopontin expression in naïve IEL from the small intestine (similar results were obtained with colon, not shown) of Rag-2-/-Spp-1-EGFP-KI mice. Cells were gated as in Fig 1. Histogram is a representative mouse (n = 4). Data are representative of at least two independent experiments. **p<0.01, using unpaired two-tailed Student’s T test for (a) and non-parametric one-way ANOVA for (b).

