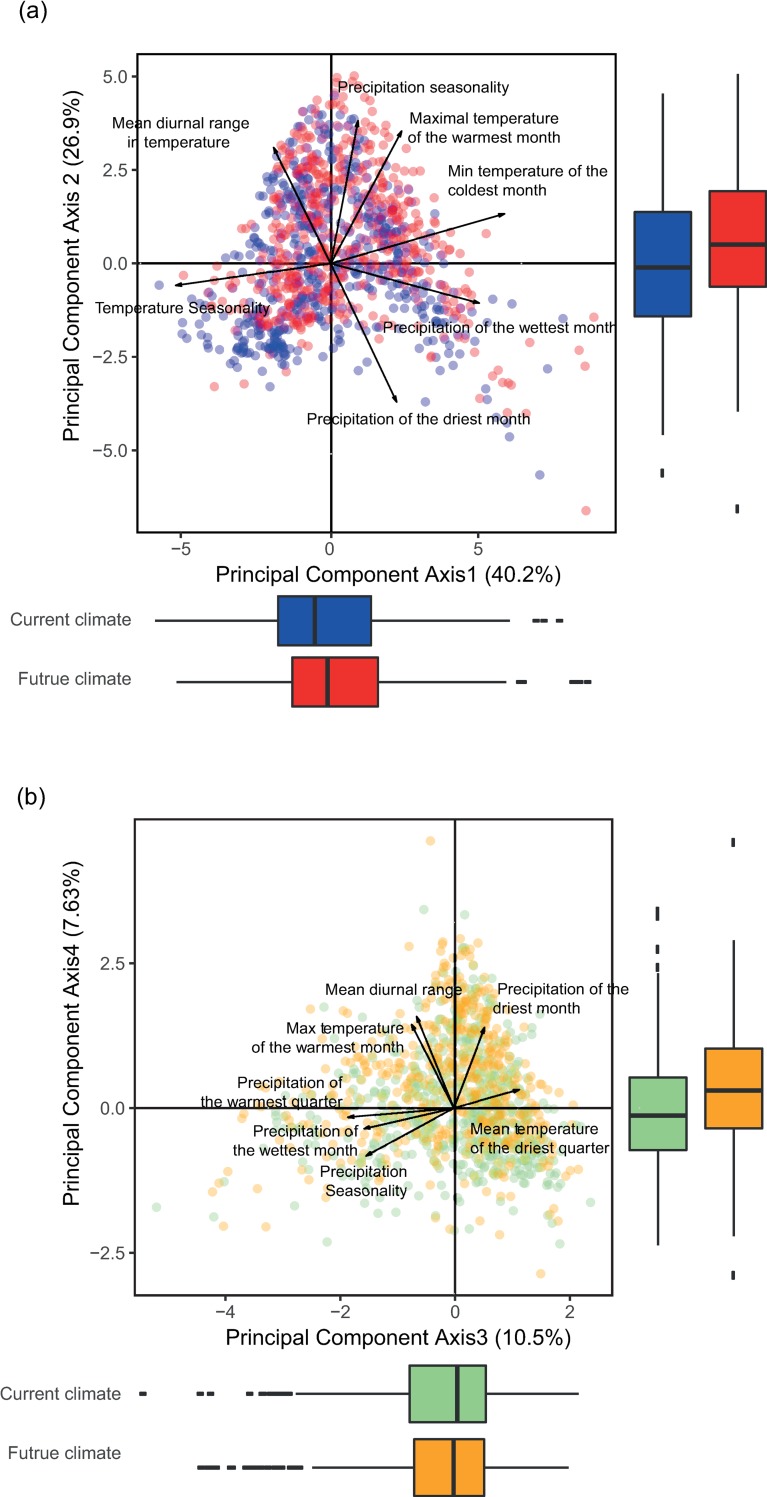
Fig 1. Distribution of current and future cities along the first 4 principal component axes.
The seven major climate variables contributing to the Principal Component Analysis (PCA) are superposed on each figure. The figure at the top (a) shows the distribution of current (blue) and future (red) cities on the space defined by the first two principal components. The first two axes explain, respectively, 40.2 and 26.9% of climate variations. The first axis is mainly driven by differences in temperature seasonality and in minimum temperature of the coldest month, while the second axis is mainly driven by differences in precipitation seasonality. The figure at the bottom (b) shows the same current (green) and future (orange) cities on the space defined by the third and fourth principal components. They explain respectively 10.5 and 7.6% of climate variations. The third axis is mainly driven by changes in precipitation of the wet season, while the fourth axis is mainly driven by changes in the mean diurnal temperature range. Boxplots illustrates the distribution of the points along each of the 4 axes. The continuous line in the boxes represents the median of the distribution, the extremities of the boxes the 1st and the 3rd quartile and the continuous lines go up to 1.5 times the difference between the 3st and the 1rd quartile.

