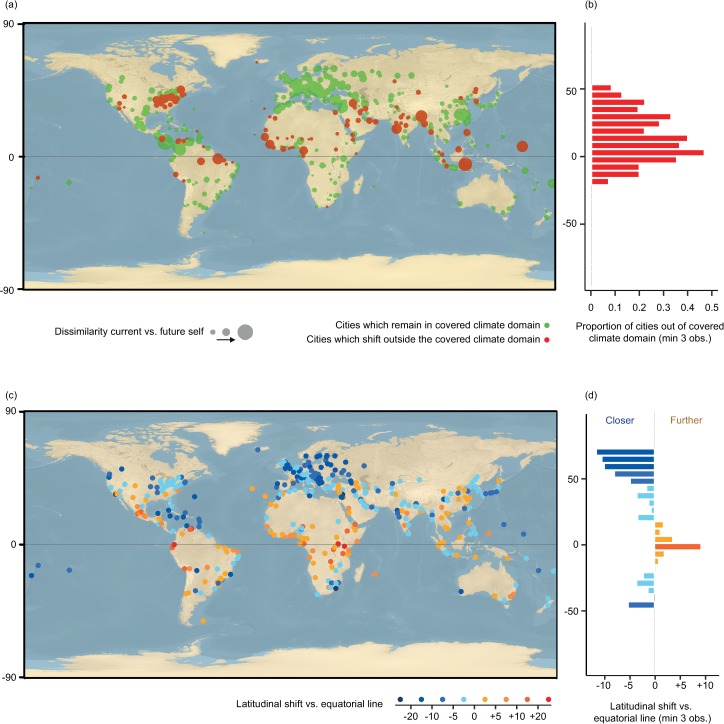
Fig 2. Extent of climate changes in major cities of the world by 2050.
a, b, the extent of change in climate conditions. Cities predicted to have climates that no major city has experienced before are colored in red (mostly within the tropics). Cities for which future climate conditions reflect current conditions in other major cities of the world are shown in green. The size of the dots represents the magnitude of change between current and future climate conditions. b, The proportion of cities shifting away from the covered climate domain (concentrated in the tropics). c,d, The extent of latitudinal shifts in relation to the equatorial line. Cities shifting towards the equator are colored with a blue gradient (mostly outside the tropics), while cities shifting away from the equator are colored with a yellow to red gradient (mostly within the tropics). d, A summary of the shift by latitude is illustrated in a barchart, with shifts averaged by bins of 5 degrees. The background of the maps are a combination rasters available in the public domain, i.e. of USGS shaded relief only and hydro cached.

