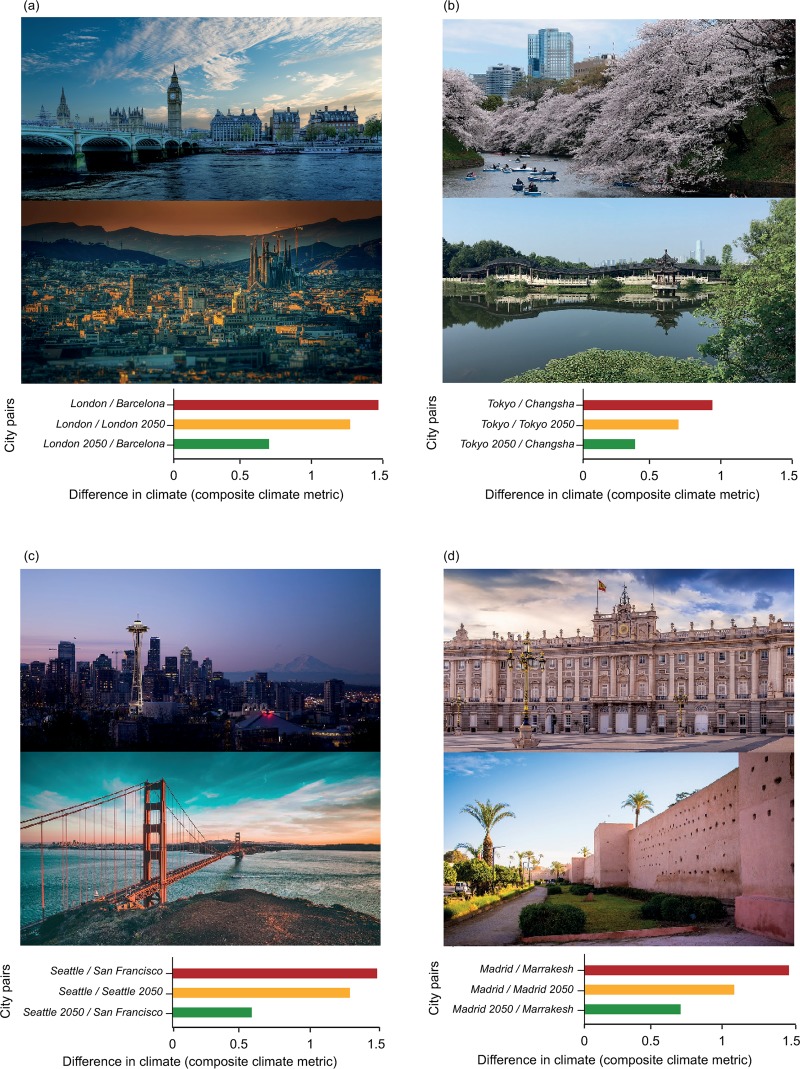
Fig 3. Future cities and similar current climate counterpart.
Difference between future and current climate for four cities and an example of their similar current counterpart. Illustration of the results of the analysis for London (a; counterpart: Barcelona), Buenos Aires (b; counterpart: Sidney), Nairobi (c; counterpart:Beirut) and Portland (d; counterpart:San Antonio). The red bar represents the difference between the current climate of the city of interest (e.g. London in (a)) and the current climate of the city to which the city of interest (e.g. London in (a)) will have the most similar climate by 2050 (e.g. Barcelona in (a)). The yellow bar the difference between the current and future climate of the city of interest (e.g. current London and London 2050 in (a)). The green bar represents the difference between the future climate of the city of interest (London 2050) and the current climate of the most similar counterpart (e.g. Barcelona in (a)). Images of Barcelona and London were obtained on Pixabay, shared under common creative CC0 license.

