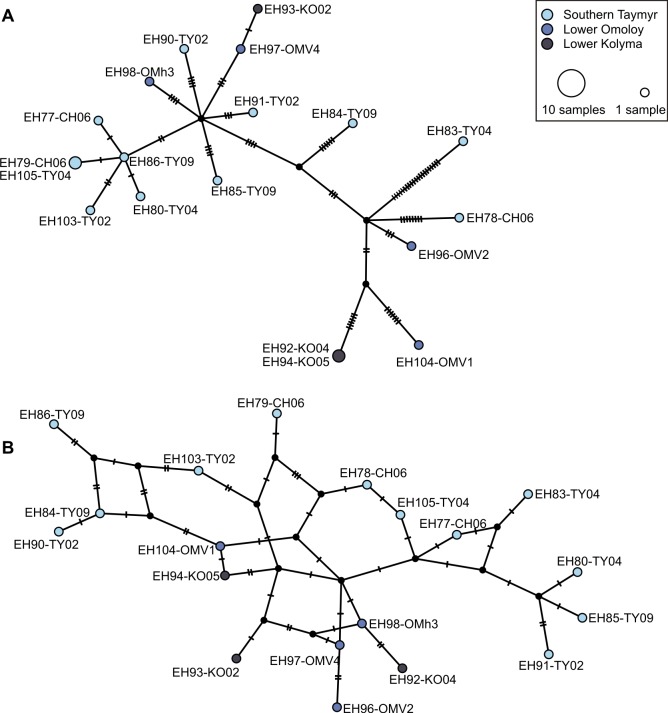
Fig 4.
Statistical parsimony haplotype networks for (A) chloroplast single nucleotide polymorphisms (SNPs) and (B) mitochondrial SNPs with haplotypes as circles, whose size is proportional to the number of individuals exhibiting this haplotype. Circles are colored according to their region of origin while small black circles represent estimated putative intermediate haplotypes. Hatch marks along the edges indicate mutations between the nodes. Loops indicate alternative pathways in the genealogy.

