
Figure 2.
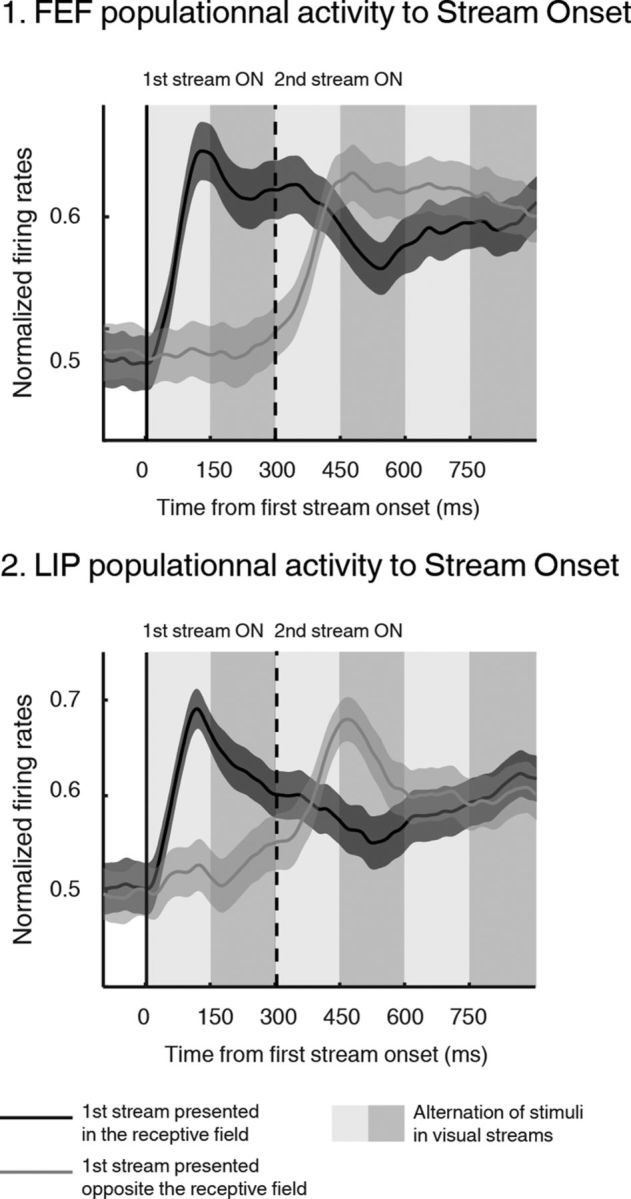
FEF and LIP population responses to the presentation of the visual streams. FEF (1) and LIP (2) population responses in trials in which the first stream was presented within the receptive field (black, mean ± SE) or opposite (gray), aligned on the first stream onset (continuous black vertical line) and simultaneously on the second stream onset (continuous dashed vertical line). The gray shades in the background correspond to the chronological succession of stimuli within each visual stream at a rate of one image per 150 ms.