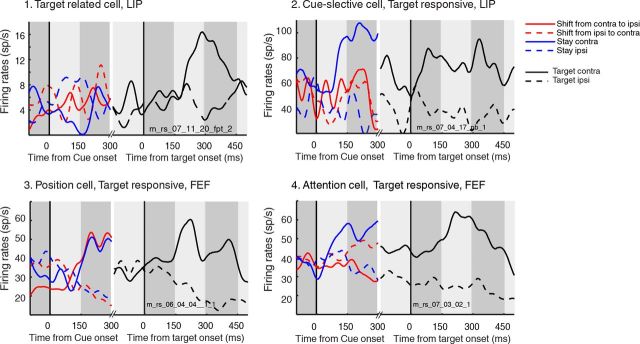
Figure 3.
Cue and target-related activities: single cell examples. For each cell, spike-density functions are represented for each of the four possible cue configurations and each of the two target positions. Cue-related responses are estimated over all correct trials. Target-related responses are estimated over all validly cued correct trials. 1, Cell specifically responding to the target presented contralaterally to the recording site (inside its RF) and showing no selectivity to cues. 2, Cell specifically responding to a Stay cue and to a target presented contralaterally to the recording site (inside its RF). 3, Cell enhanced for contralateral cues and contralateral targets (inside its RF). 4, Cell enhanced when attention is instructed contralateral to the recording site for contralateral targets (inside its RF). Cue-related responses are color coded as follows: continuous blue corresponds to Stay contralateral trials, dashed blue corresponds to Stay ipsilateral trials, continuous red corresponds to Shift from contralateral to ipsilateral trials, dashed red corresponds to Shift from ipsilateral to contralateral trials, continuous black corresponds to contralateral target trials, dashed black corresponds to ipsilateral target trials. The gray shades in the background correspond to the chronological succession of stimuli within each visual stream at a rate of one image per 150 ms.

