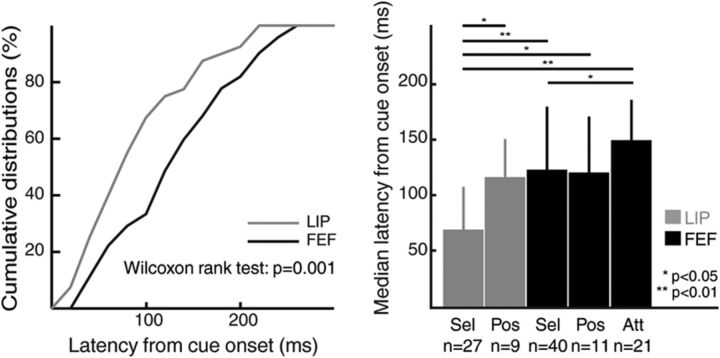
Figure 6.
Cue-related activities: cell latency analysis. Left: Cumulative distribution of cue-response latencies for both FEF (black) and LIP (gray). Right: Median latency (plus median absolute deviation) for each cue subpopulation. Sel indicates selective cue cells; Pos, position cue cells; Att, attention cue cells. No values were available for the LIP Att category because n = 4. *p < 0.05; **p < 0.01, Wilcoxon rank test.

