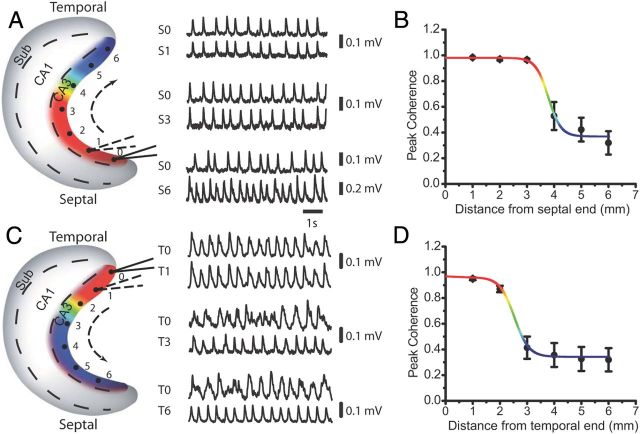
Figure 2.
CA3 oscillations along the septotemporal axis. A, C, Seven recording sites were evenly distributed along the septotemporal (S-T) axis of the CA3 area with 1 mm interval spacing. 0, the reference electrode placed at the septal region (A) and temporal CA3 (C) end of the hippocampus. The second electrode was then moved from recording positions 1–6 to record CA3 oscillations along the septotemporal axis. Sample traces of CA3 oscillations recorded from reference electrode (0) and the second electrode (1, 3, and 6) are shown. B, D, averaged peak coherence was calculated between oscillations recorded from reference electrode (0) and the second electrode (1–6); n = 7. A sigmoid curve was then fitted based on the averaged coherence numbers with color spectrum from red (high value) to blue (low value). The color map of coherence distribution was then transferred and plotted in the CA3 area of the hippocampus model (A,C, colored area).

