
Figure 4.
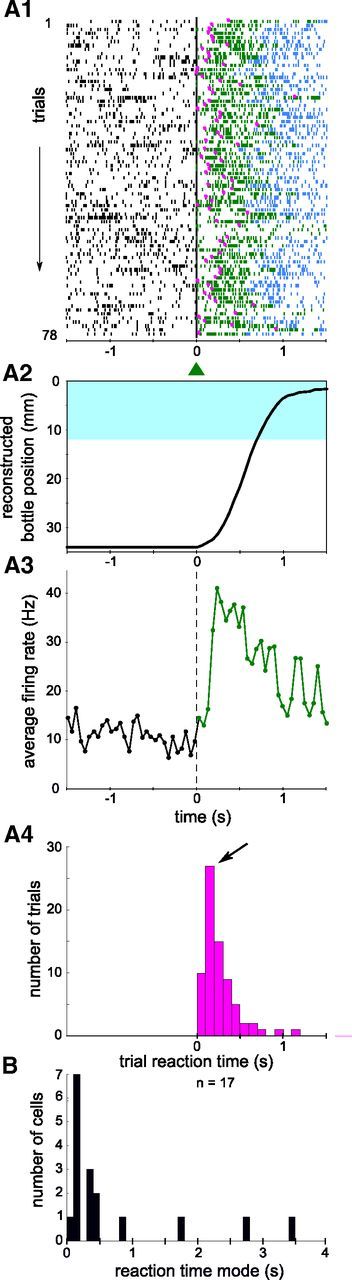
Reaction times of conditioned neurons after learning. A1, Raster plot of the activity of a neuron selected for operant conditioning around trial start (t = 0). Ticks represent spike times and they are colored depending on the experiment phase (black: waiting; green: trial; blue: reward periods). Small magenta dots mark the calculated individual trial latencies. A2, Bottle position averaged over trials for the same session. The blue area represents the drinking zone. A3, Perievent time histogram for the session shown in A1, for the waiting period (black line before 0) and the trials (green line after 0). The activity during reward periods (blue spikes in A1) was not included. Bin size, 50 ms. A4, Distribution of individual trial latencies for the same session, plotted in 100 ms bins. The peak of the distribution, defining the neuronal reaction time, is indicated by an arrow. B, Distribution of the best neuronal reaction time for all 17 conditioned neurons, in 100 ms bins. The session with the highest conditioning effect was used for each neuron (best session, see Materials and Methods).