
FIGURE 4.
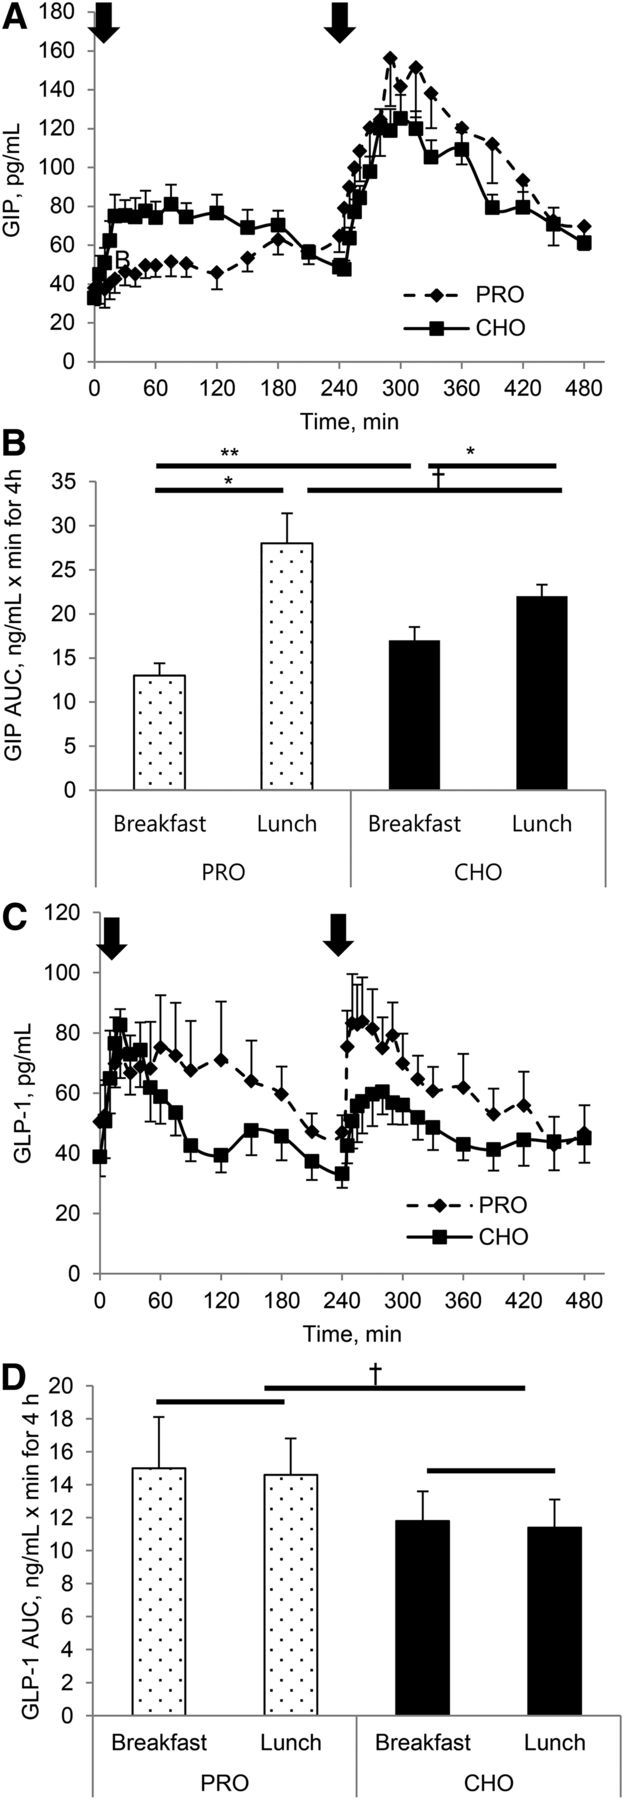
GIP concentration (A) and AUC (B) and GLP-1 concentration (C) and AUC (D) responses to either a high-protein or a high-carbohydrate breakfast and a standardized lunch in individuals with T2D. Arrows indicate when meals were consumed. Values are means ± SEMs, n = 12. *Different between breakfast and lunch, P < 0.05; **Different from corresponding meal compositions, P < 0.05; †Different by meal composition, P < 0.05; ‡Different from corresponding lunch, P = 0.07. CHO, carbohydrate breakfast; GIP, glucose-dependent insulinotropic peptide; GLP-1, glucagon-like peptide 1; PRO, protein breakfast; T2D, type 2 diabetes.