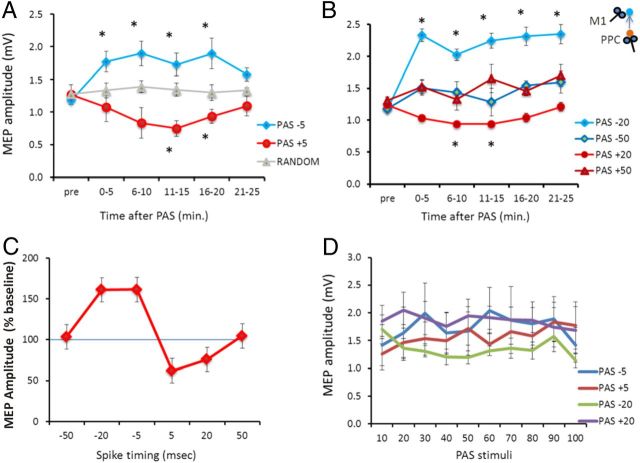
Figure 2.
PAS between the PPC and M1 with PA orientation. Aftereffects of PPC–M1PA+5 ms, PPC–M1PA−5 ms, and random PAS (A) and PPC–M1PA+50 ms, PPC–M1PA+20 ms, PPC–M1PA−20 ms, and PPC–M1PA−50 ms PAS (B) on MEP amplitude at baseline and different time points. C, Mean normalized data (percentage of change compared with baseline) obtained at the 11–15 min block after each PAS protocol. The emerging temporal profile follows the rules of anti-Hebbian STDP. D, Mean MEP amplitude during the paired PPC–M1 plasticity-inducing protocols at −5, −20, +5, and +20 ms. Error bars indicate SEM. *p < 0.05.

