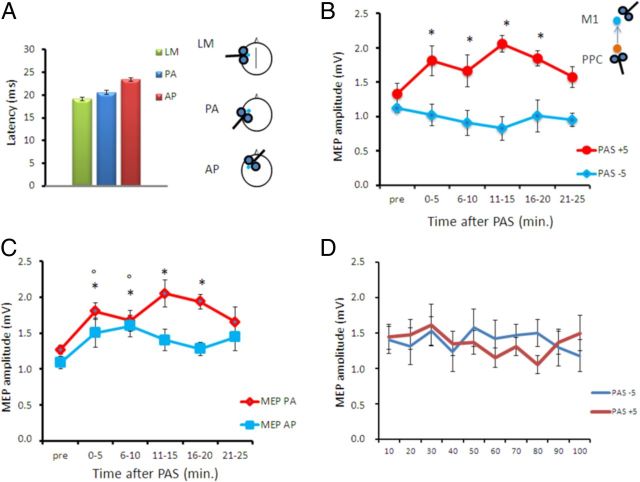
Figure 3.
PAS between the PPC and M1 with AP orientation. A, Mean MEP latencies obtained with different coil orientations. B, Aftereffects of PPC–M1AP+5 ms and PPC–M1AP−5 ms PAS on MEP amplitude. The induced STDP is opposite to that in Figure 2, compatible with a temporal profile that follows the rules of standard Hebbian STDP. C, Aftereffects of PPC–M1AP+5 ms PAS on MEP amplitude tested with different coil orientations. D, Mean MEP amplitude during the paired PPC–M1AP plasticity-inducing protocols at −5 and +5 ms. Error bars indicate SEM. *p < 0.05 compared with baseline. In B, * refers to MEP PA and ° refers to MEP AP.

