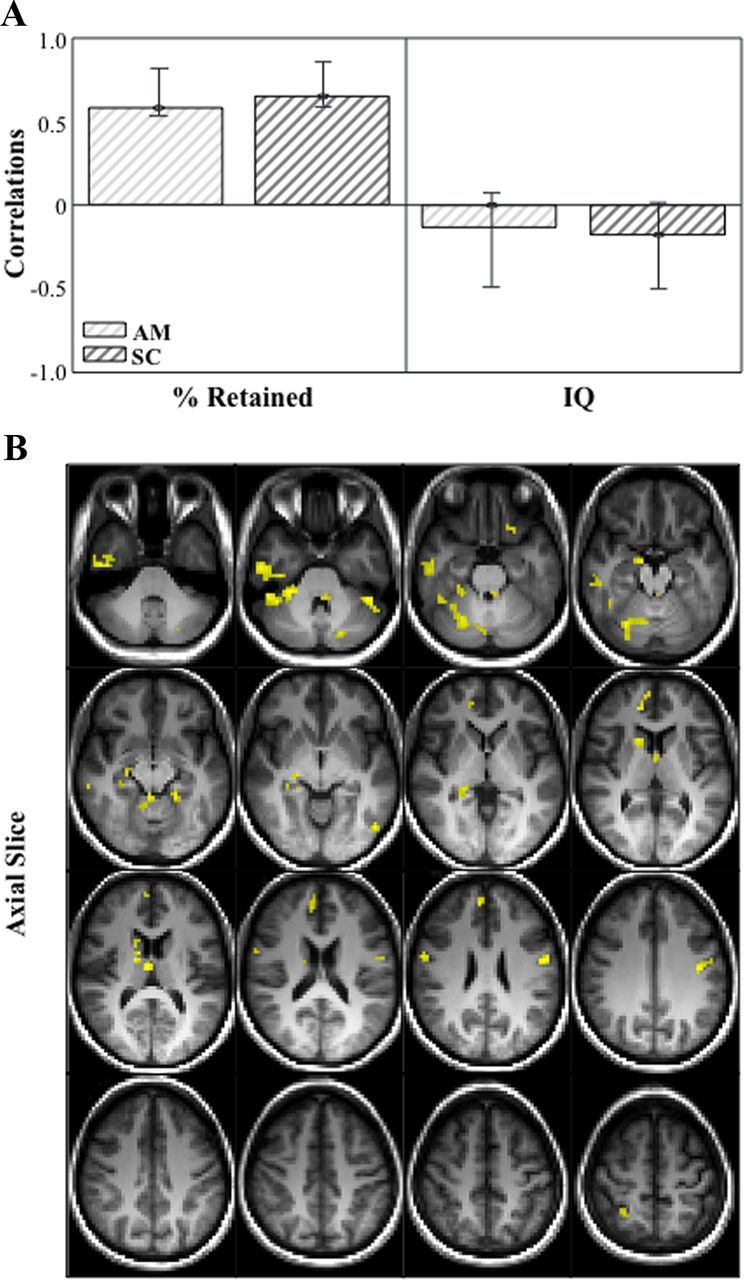
Figure 2.

Correlation bar graph (A) and singular image (B) for LV1 from the SD in fMRI signal in autobiographical memory and sentence completion behavior-PLS analysis. The correlation bar graph (A) captures the task-dependent correlations between our behavior measures (percent retained and IQ) and the regions identified in the singular image. The error bars show the 95% confidence interval derived from bootstrap estimation. The error bar crosses zero for IQ scores in both AM and SC tasks, indicating that there is no stable contribution from IQ to the pattern identified in the singular image. The singular image (B) shows brain signal variability-behavior correlations for AM and SC, displayed on axial slices in MNI atlas space. The brain is displayed according to radiological convention (L = R). Regions highlighted in in yellow indicate a positive correlation between brain variability in both tasks and memory performance.
