Figure 3.
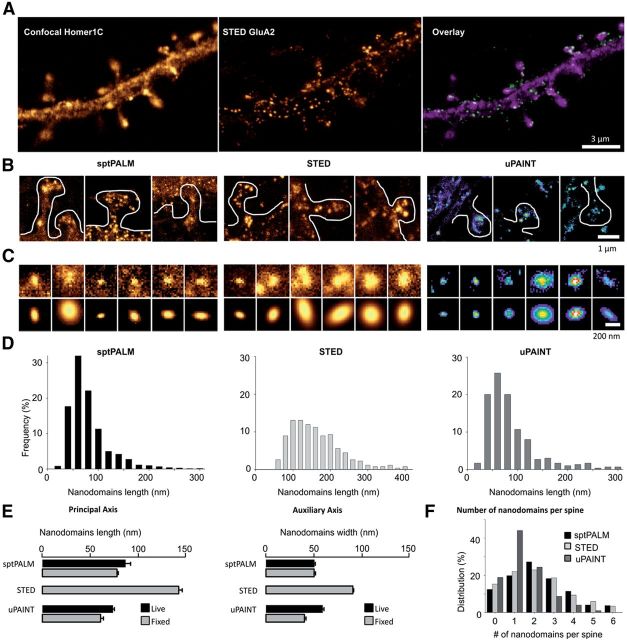
Quantification of AMPAR nanodomain size and density by multiple super-resolution light imaging techniques. A, Confocal and STED images of a dendritic segment expressing Homer1c::GFP (left, confocal) that was live-stained for Surf-GluA2-ATTO647N for STED imaging (middle, STED). Overlaid images (right; Homer1c::GFP shown in magenta; STED GluA2 shown in green). B, Gallery of super-resolution images of spines imaged by sptPALM (Eos::GluA1), STED, and uPAINT (Surf-GluA2-ATTO647N). C, Examples of AMPAR nanodomains imaged by sptPALM, STED, and uPAINT, and the corresponding fit using 2D anisotropic Gaussian functions. D, Distributions of the principal (length) axis of nanodomains obtained by 2D anisotropic Gaussian fitting. sptPALM, STED, and uPAINT display similar distributions centered at 80, 120, and 70 nm, respectively. E, Comparison of the mean lengths (principal) and widths (auxiliary) of nanodomains in living and fixed cells for the different techniques. F, Quantification of the number of nanodomains per spine with the different imaging techniques shows that ∼50% of spines contain one or two nanodomains.

