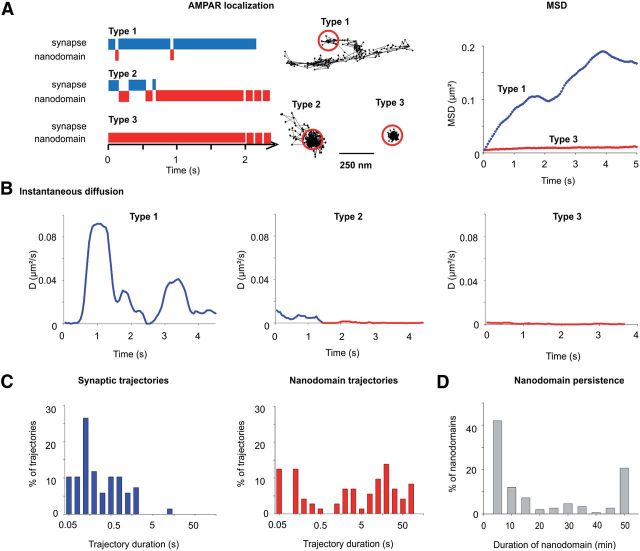
Figure 5.
Dynamics of AMPAR nanodomain composition, shape, and position. A, Illustration of the diffusive behavior of Surf-GluA2-ATTO647N-labeled endogenous AMPAR inside and outside nanodomains observed by uPAINT. Measurement of the dynamics of AMPAR localization illustrates three different types of behavior within and in between nanodomains. The times spent by individual AMPAR inside and outside nanodomains are represented in red and blue, respectively. In Type 1, AMPAR randomly diffuse in the vicinity of nanodomains without getting trapped. In Type 2, AMPAR alternate between inside and outside the nanodomains before getting strongly trapped in the nanodomain and confined. In Type 3, AMPAR are immobilized for the duration of the recording in the nanodomain. Examples of trajectories for the three types of behaviors are displayed, with red circles indicating the nanodomains. MSD curves of Type 1 (blue) and Type 3 (red) illustrate a strong confinement of Type 3 molecules compared with Type 1. B, Graph of the instantaneous diffusion coefficient versus time that reveal a slow AMPAR diffusion inside nanodomains and a much faster one in synapse but outside of nanodomains. C, Duration of synaptic single-molecule trajectories inside and outside nanodomains. Synaptic trajectories outside nanodomain display a residency time of <500 ms for >90% of the observed trajectories. For intrananodomain molecules, the residency time is longer than 5 s for at least 50% of the trajectories, confirming the AMPAR retention inside nanodomains. D, Nanodomain stability histogram measured using time-lapse sptPALM shows that >20% of the nanodomains remain stable during the entire experiment duration (almost 1 h).

