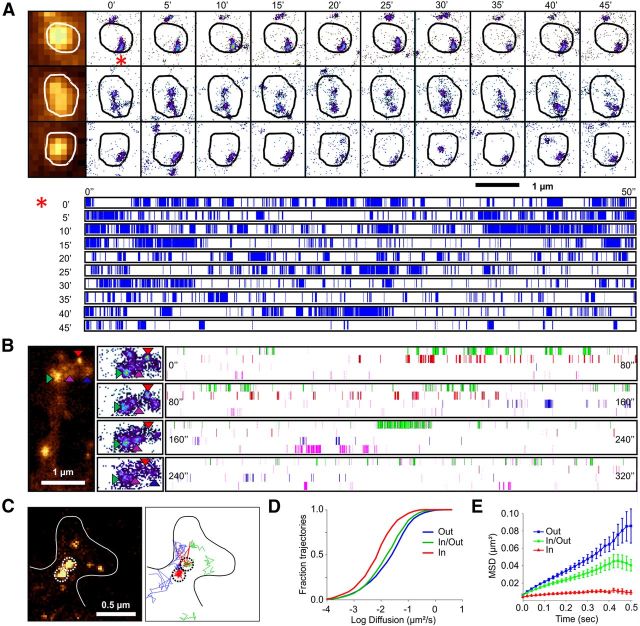
Figure 6.
Time-lapse sptPALM recordings reveal stability of nanodomains. A, Examples of time-lapse sptPALM on three different synapses and the corresponding kymographs showing the presence of single molecules inside one nanodomain over time. Left side column, Epifluorescence images of the synapses labeled by Homer1c::Cerulean. Pseudo-color galleries represent the Eos::GluA1 super-resolution sptPALM intensity images acquired during 50 s every 5 min. It shows that some nanodomains remain stable for the time of observation (first row), whereas the second and third rows display a more dynamic behavior of nanodomains or spine, including appearance and disappearance events. The kymograph displays the detection of fluorescent single molecules over time inside a nanodomain identified by the red star. Several possible patterns of single molecule fluctuations are visible along the time course, confirming that each nanodomain is a result of immobilization of several Eos-tagged GluA1 subunits. B, Kymograph of multiple nanodomains on a single spine extracted from a sptPALM experiment. Left side image, Super-resolution sptPALM intensity image of Eos::GluA1. The second column represents the super-resolution sptPALM intensity image sequence of the corresponding spine head every 80 s. The arrows point to different nanodomains. Right column, Kymographs computed for each nanodomain represented by their respective color. The patterns of fluctuations denote that, whereas some domains are highly stable over time, other domains appear and disappear in the time range of minutes. C, Left panel, sptPALM intensity image of a spine expressing EOS::GluA1. Nanodomains are identified by a dashed circle. Right panel, Projection of a subset of single-molecule trajectories observed in the corresponding spine. Red represents strongly confined trajectories; blue and green represent diffusive and weakly confined trajectories, respectively. D, Cumulative distribution of instantaneous diffusion coefficients of the trajectories observed exclusively inside nanodomains (In), exclusively outside nanodomains (Out), or exchanging between inside and outside nanodomains (In/Out). E, Average mean square diffusion plots for single-molecule trajectories observed exclusively inside nanodomains (In), exclusively outside nanodomains (Out), or exchanging between inside and outside nanodomains (In/Out).

