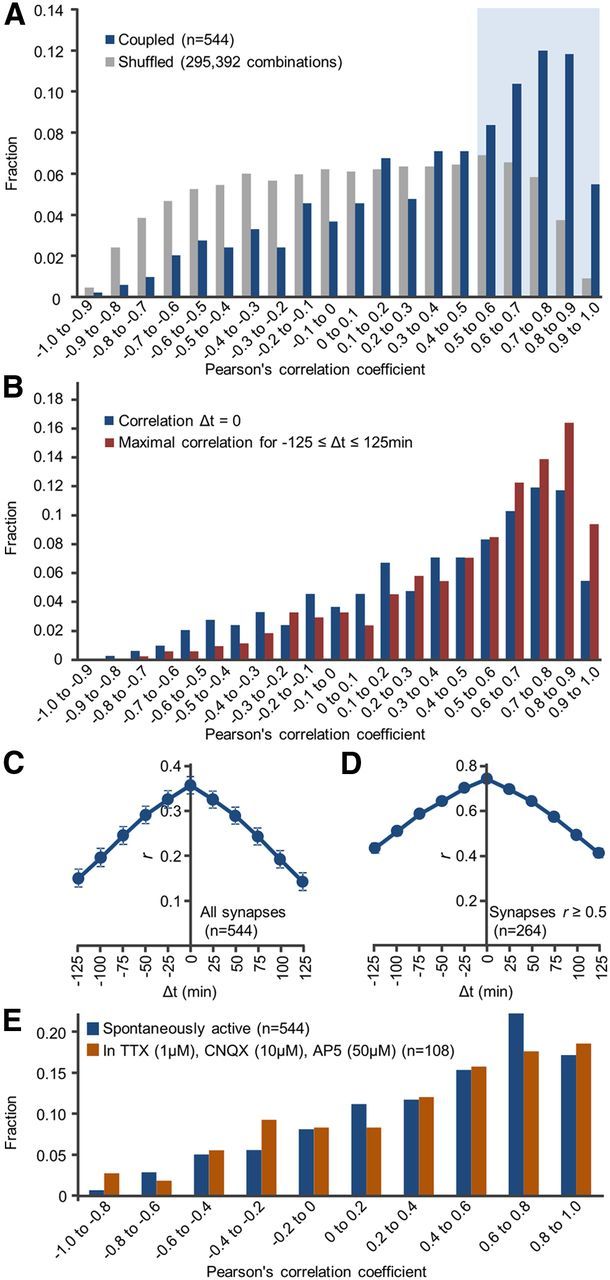
Figure 2.

Temporal correlations between Munc13-1:EYFP and PSD95:mTurq at individual synapses. A, Distribution of temporal correlation coefficients for all synapses (“coupled”; red) and for all combinations of unassociated Munc13-1:EYFP and PSD-95:mTurq puncta (“shuffled”; gray, 295,392 combinations). Blue area represents synapses for which r ≥ 0.5. B, Distribution of best correlation coefficients obtainable by temporally offsetting changes in one compartment in respect to other by ±125 min. C, Mean ± SEM cross-correlation values for all synapses. D, Only for synapses for which r ≥ 0.5. E, Distribution of temporal correlation coefficients in the presence of pharmacological agents that block glutamatergic synapses and network activity.
