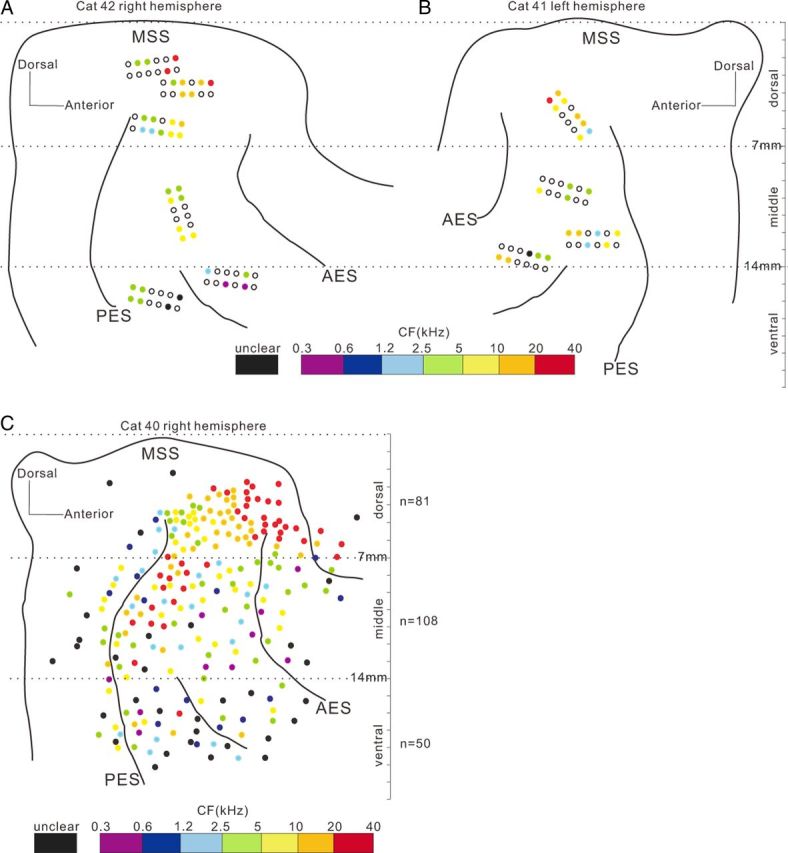
Figure 1.

Schematic of the AC shown by the principle sulci. A, B, Spatial distribution of cortical implanted electrodes in two representative cats. Filled circles represent electrode sites at which unit data were obtained. Color shows the CFs (color legend at bottom). Black-outlined and colorless circles represent electrode sites without unit data. Dashed lines are the borders used to divide units into dorsal, middle, and ventral areas. C, Spatial distribution of CF systematically examined through a single electrode on a head-fixed cat, indicating a difference of pure-tone responsiveness among the areas delineated by 7 and 14 mm lines to MSS. Neurons dorsal to the 7 mm line showed a clear gradient of CF along the posterior–anterior direction. Between 7 and 14 mm lines, the CF gradient disappeared. In the area ventral to the 14 mm line, more neurons did not respond to pure tones and the CF was unclear, represented by black dots.
