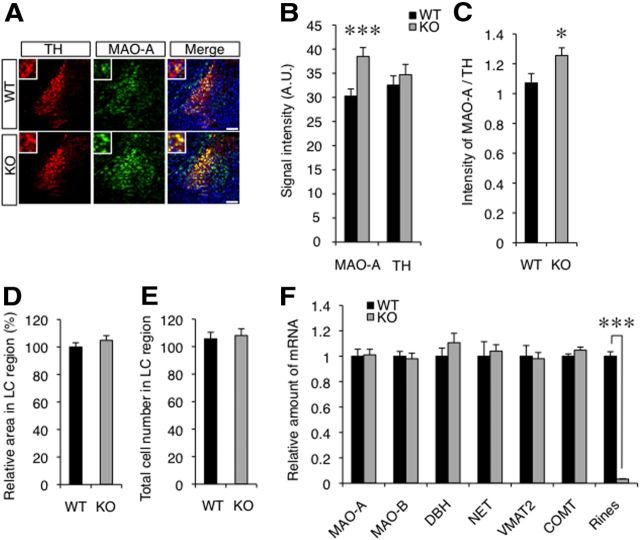
Figure 6.
Rines regulated MAO-A protein level. A–C, Rines KO mice showed significantly increased MAO-A protein levels in the LC region. A, Representative immunofluorescence staining of TH and MAO-A proteins in the LC region from WT and Rines KO mice. High-magnification images of the center regions are shown in insets. WT, n = 5; KO, n = 5. Scale bar, 100 μm. B, Quantitative analyses of signal intensities for MAO-A and TH. ***p < 0.001, Student's t test. AU, arbitrary unit. C, Intensities of MAO-A relative to TH. **p < 0.01, Student's t test. D, E, Comparison of the areas and total cell numbers in the LC regions of WT and Rines KO mice. There were no significant differences in the area (D) or number (E) of TH-expressing cells in the LC region between the two genotypes. WT mean values = 100% (D). WT, n = 5; KO, n = 5. F, The relative amount of mRNA in the LC region isolated from WT and Rines KO mice measured with quantitative RT-PCR. DBH, dopamine β-hydroxylase; NET, NE transporter; VMAT2, vesicular monoamine transporter protein 2; COMT, catechol-O-methyltransferase. No differences were detected in the mRNA levels of these proteins between the genotypes. WT, n = 7; KO, n = 7; ***p < 0.001, Welch's t test. WT values are indicated as 1.

