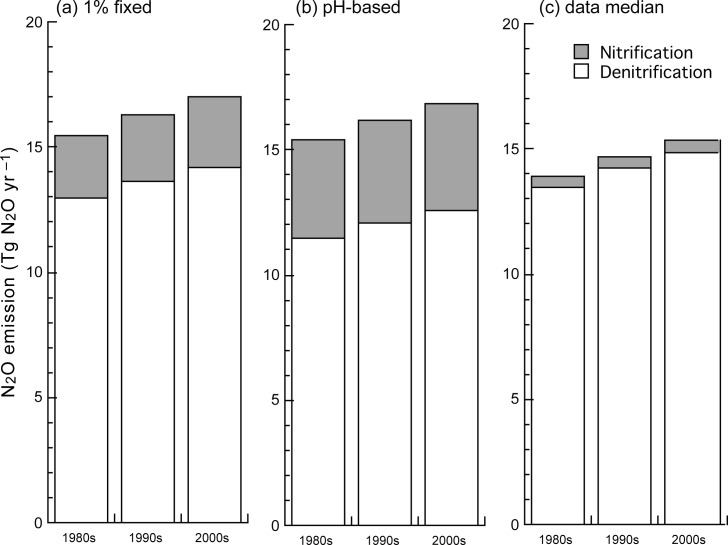
Fig 6. Sensitivity analysis of global N2O emission to the fraction of nitrification-associated N2O emission, fN2Onit.
(a) Fixed 1%, (b) soil pH-based parameterization, and (c) median of meta-analysis records (0.139%, outliers removed). Each N2O flux was estimated by using the VISIT model. Decadal mean values for the 1980s, 1990s, and 2000s are shown.

