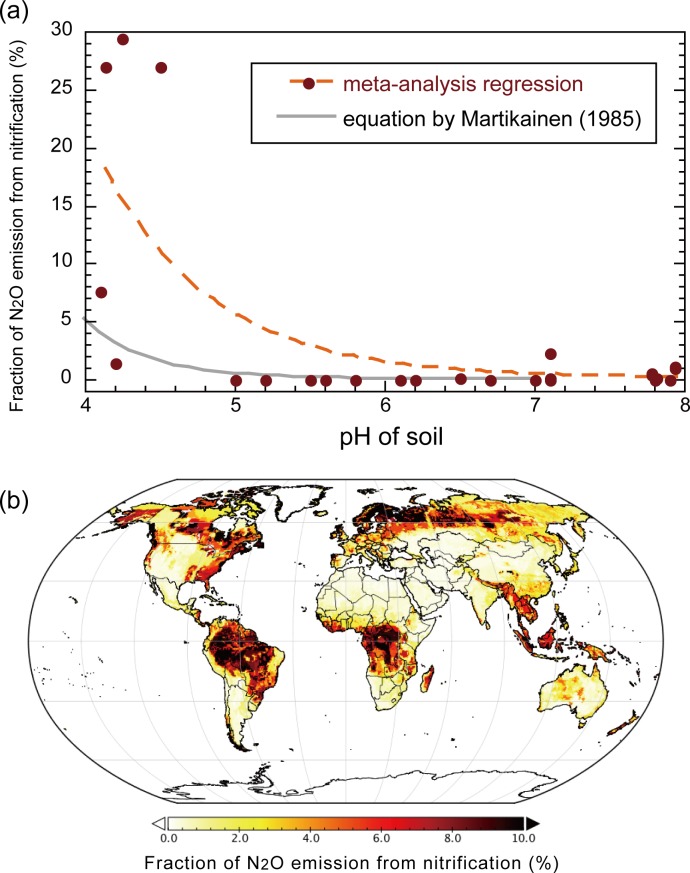
Fig 7. Parameterization of nitrification-associated N2O emission fraction, fN2Onit as a function of soil pH.
(a) Relationships in the meta-analysis data. Orange dashed curve is obtained by Gauss-Newton non-linear regression of an exponential function: fN2Onit = 47.59 exp(–1.345 · pH) (R2 = 0.557). Grey curve shows an empirical function by Martikainen (1985) for reference. (b) Global distribution of fN2Onit estimated using the regression curve and soil pH map (S1 Fig).

