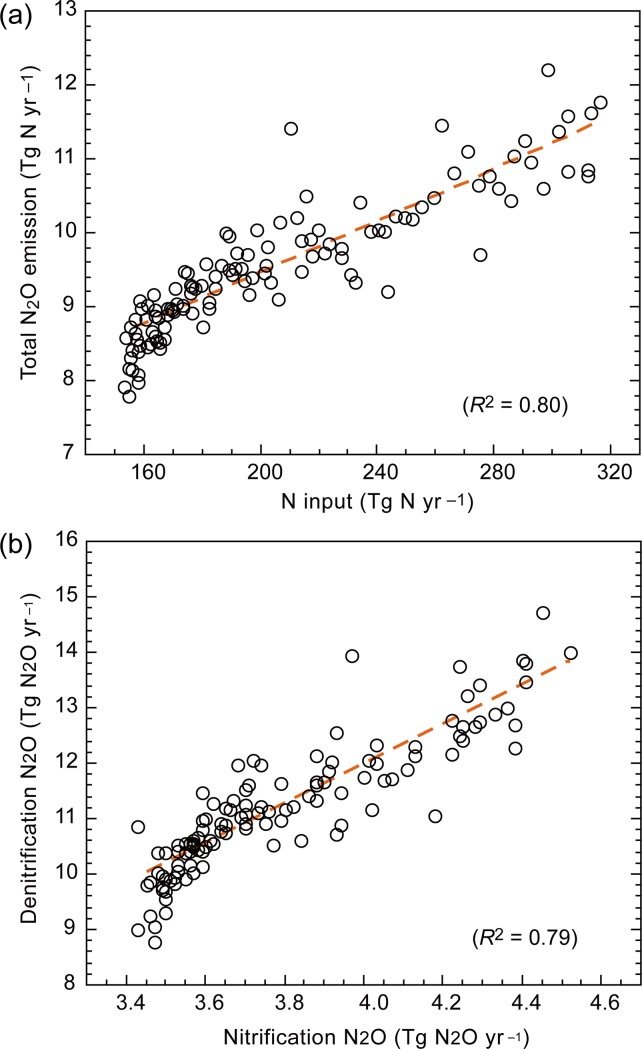
Fig 10. Relationships in the simulated global nitrogen budget by VISIT model with the pH-based parameterization of fN2Onit.
(a) Total N2O emission related to nitrogen input by biological fixation, atmospheric deposition, and fertilizer. Orange dashed line shows liner regression: N2O emission = 0.0175 N-input + 5.94 (R2 = 0.804). (b) Relationship between nitrification- and denitrification-associated N2O emission: N2O-denitrification = 3.57 N2O-nitrification– 2.33 (R2 = 0.794). Simulation data from 1901 to 2015 were used.

