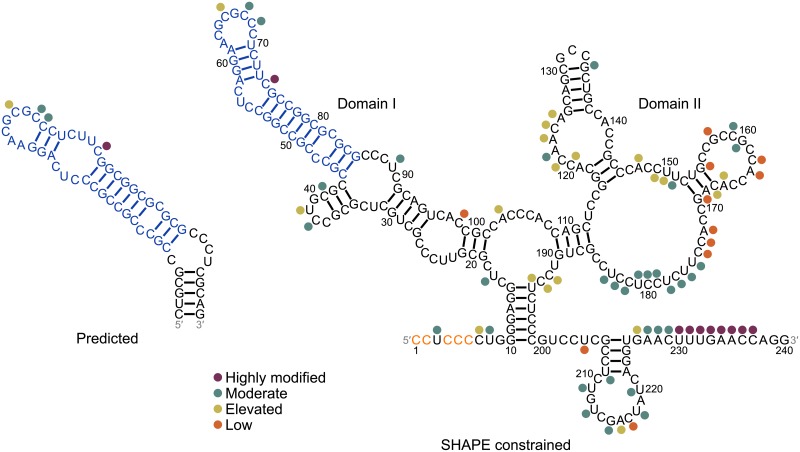
Fig 5. Predicted and SHAPE constrained structures of the human 5′ UTR.
Predicted structure corresponds to nt 120–176. Structure determined by SHAPE analysis corresponds to the 240 nt tau IRES.[73] The conserved 5′-CCUCCCC-3′ sequence that promotes cap-dependent translation is colored orange. Blue nucleotides in the SHAPE constrained structure correspond to those in the predicted structure. Nucleotides in the SHAPE constrained structure that were modified in SHAPE analysis are indicated by circles colored according to SHAPE reactivity (see figure key). For reference, nucleotides in the predicted structure that correspond to those in the SHAPE-constrained structure are labeled with the respective colored circles. SHAPE reactivities were obtained from ref. [73].

