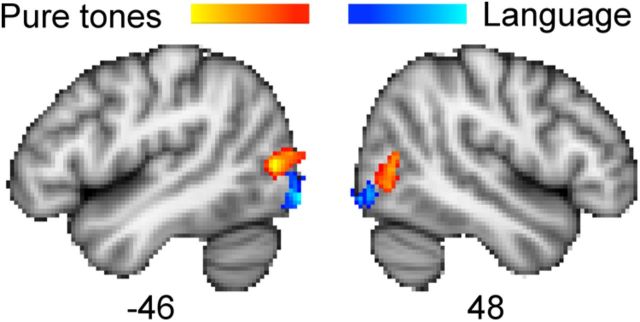
Figure 4.
Occipital cortex activity in anophthalmic subjects. Colored statistical maps representing the areas in occipital cortex activated in anophthalmic subjects when listening to tones compared with rest (orange) and speech compared with reversed speech (blue) (Watkins et al., 2012). Statistical contrasts showing regions in which activity was greater in the anophthalmic group compared with sighted controls are thresholded (voxelwise for visualization, Z > 3.1) and overlaid on the MNI-152 T1-weighted image. The numbers below each slice are the coordinates (in millimeters) in MNI-152 standard space.

