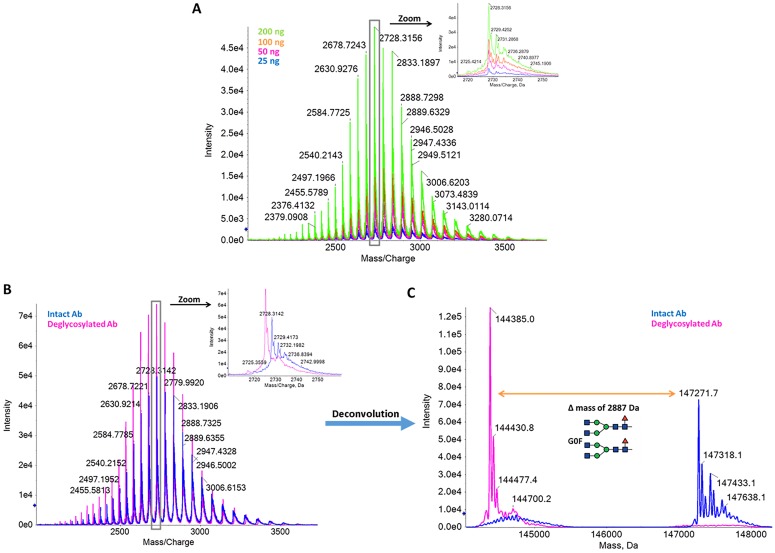
Fig 2. Protein level analysis of intact recombinant monoclonal antibody (characterization level 1).
(A) TOF MS spectra of monoclonal recombinant antibody, from 25 ng to 200 ng on column injection. The inset shows a zoom view of the m/z 2728.31. (B) TOF MS spectra of untreated (blue line) and PNGase-treated (pink line) antibody. A mass shift and reduction of heterogeneity are observed upon PNGase treatment. (C) Deconvolution results of intact (blue line) and deglycosylated antibody (pink line). Glycosylation heterogeneity is clearly detected in the intact antibody. The two major glycosylation species detected are highlighted in the zoom view.

