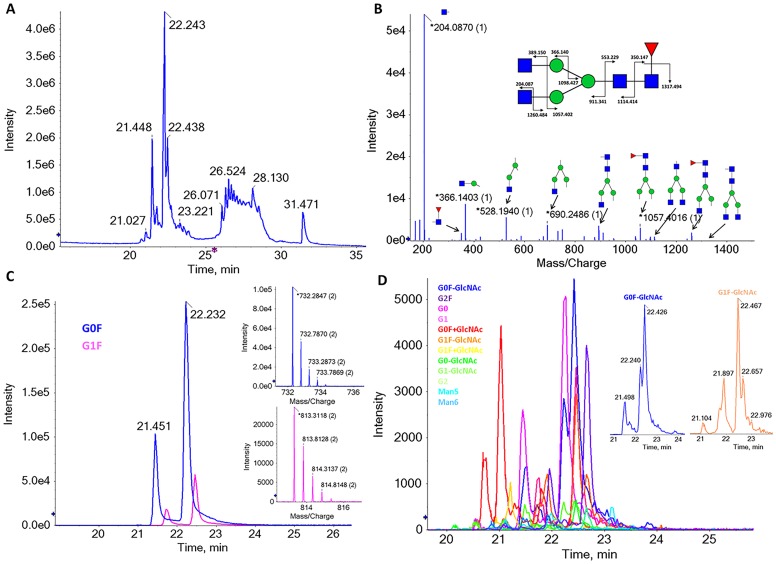
Fig 6. PNGase-released N-glycans analysis (characterization level 4).
(A) Total ion current mass chromatogram of N-glycans analysed with PGC nanoLC-MSMS. (B) MSMS data of G0F glycan structure with the higher abundant fragments highlighted. A full analysis of the MSMS data for G0F is shown in supplementary data. (C) XICs of the two most abundant glycan structures, G0F and G1F, and the mass spectra of the corresponding doubly charged m/z ions of these structures. (D) XICs of all other detected glycans. A zoom view of G0F-GlcNAc and G1F-GlcNAc is also shown.

