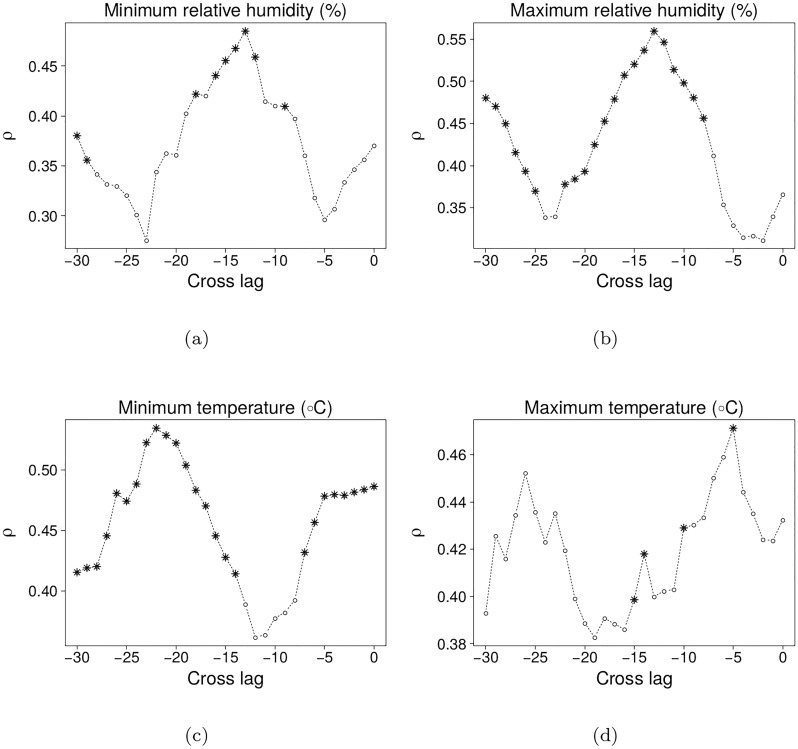
Fig 3. Significant causal relationships as a function of time-lag via CCM.
Plots show in x-axis the time-lags tested for each climate variable and in y-axis the prediction skill ρ of the observed mean number of malaria cases. Asterisks represent time-lag values that provided a larger ρ than expected by a common seasonal trend, considered significant with α = 0.05.

