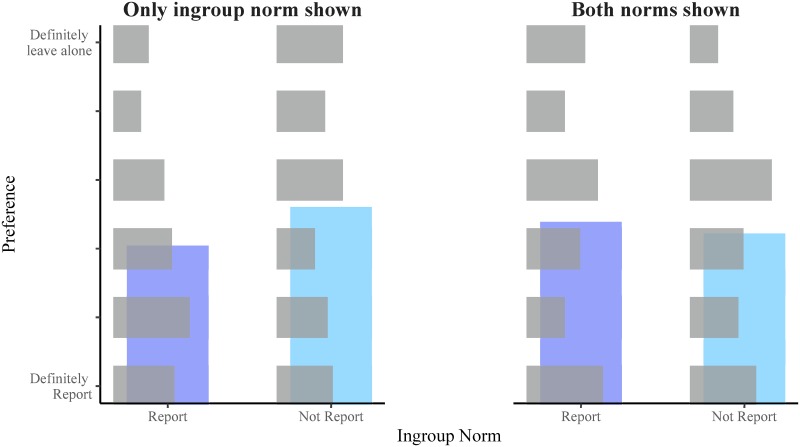
Fig 3. Distribution of responses by condition in Experiment 2.
The horizontal grey bars represent the distribution of responses for each condition in Experiment 2. The vertical blue bars show the mean response for each condition to give an indication of the direction that responses shifted between conditions.

