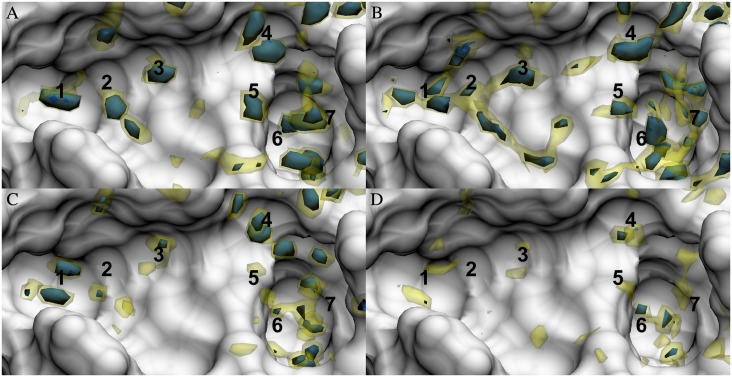
Fig 2. Solute-water pair distribution functions in the FXa binding site.
Oxygen pair distribution functions as calculated by (A) MD and (B) 3D-RISM. Hydrogen pair distribution functions as calculated by (C) MD and (D) 3D-RISM. Isosurfaces are shown for 4 (yellow) and 8 (blue) times bulk density. The FXa solvent accessible surface is shown in white. Numbers identify density regions that are discussed in the text.

