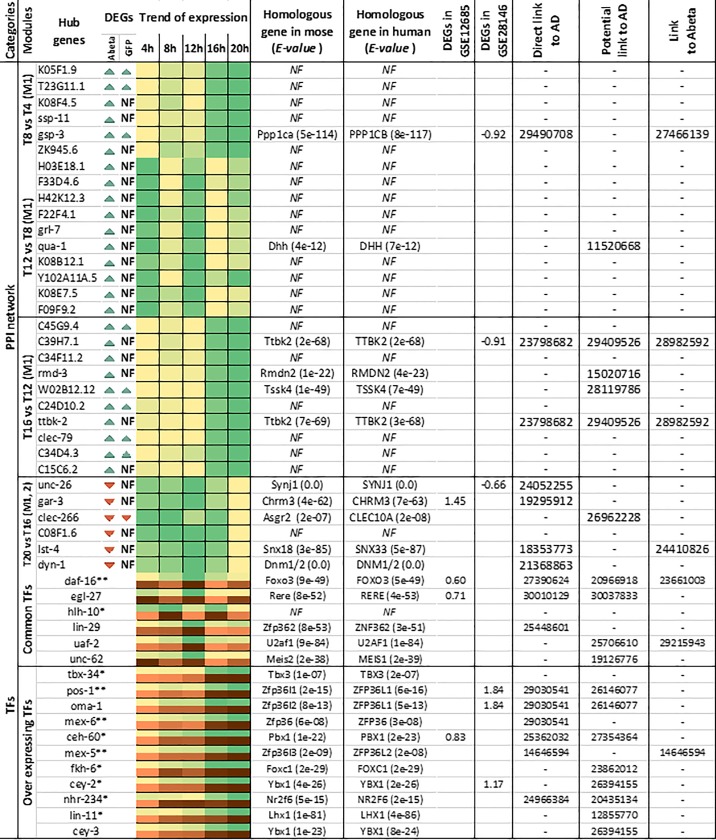
Fig 10. The top hub genes (Maximum 10) detected in the PPI networks at different stages of Abeta accumulation have been listed.
For each gene, expression trends through time-points (every 4 hours), mouse and human homologous genes were extracted and presented. For identified homologous genes, expression status in two datasets from human incipient Alzheimer’s disease, the direct relationship with Alzheimer’s disease, any potential role in Alzheimer’s or association with Abeta accumulation were also included. For each gene, higher intensity in color shows higher expression. NF indicates homologous genes could not be found. * TFs responding to Abeta accumulation through development, ** TFs uniquely responding to Abeta accumulation when compared to GFP sample at the same developmental stage. Brown and green bars indicate trends of expression in response to GFP and Abeta accumulation, respectively. Darker color indicates more expression.

