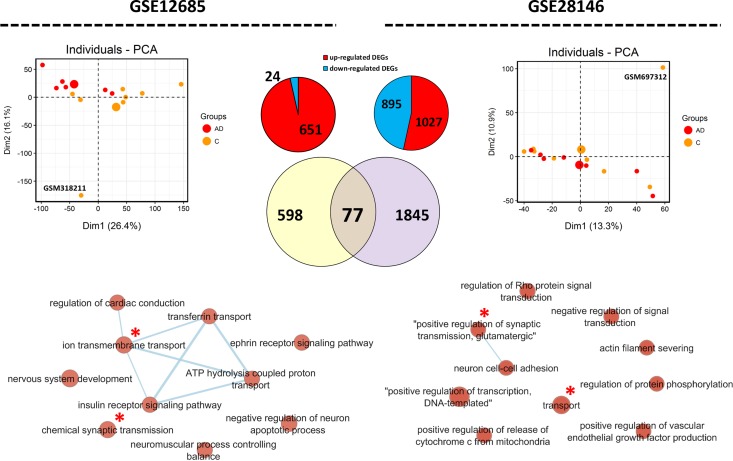
Fig 11. Transcriptome analysis of samples obtained from human data at incipient Alzheimer’s disease.
We have analyzed two datasets, GSE12685 and GSE28146. PCA was performed, which as expected showed noticeable heterogeneity among samples. DEGs were detected using GEO2R tool. 77 common DEGs were detected between the two datasets. Enrichment map of biological processes show that transport (transmembrane) and actin organization are common in both datasets (indicate by red stars). Nodes in larger size contain a larger number of involved DEGs in the biological process. In the PCA graph, large dots are average of all the samples of that group.

