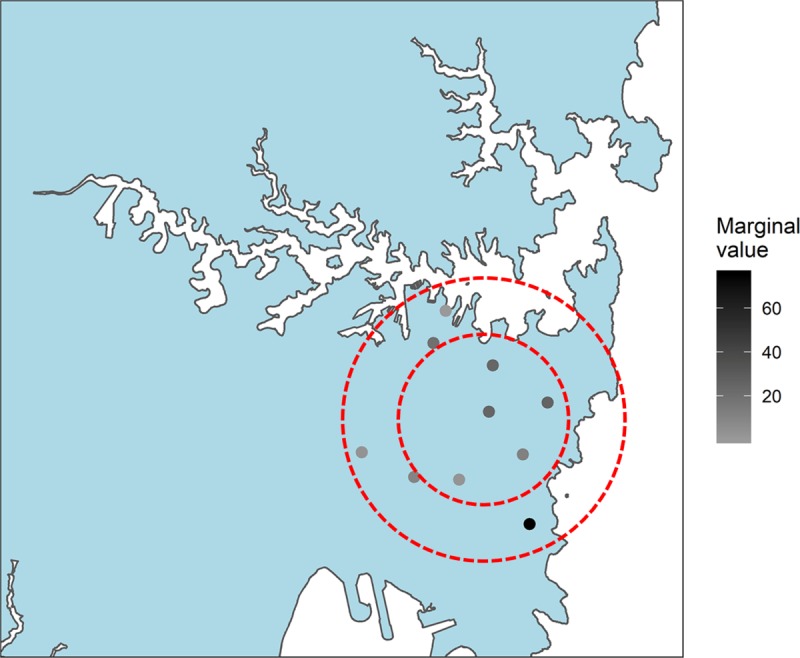
Fig 1. A potential map that users could be presented with, demonstrating the relative value of sites within their user-specified distance they are willing to sample (the dotted lines).

The small circle could represent weekday sampling, whereas the larger circle could represent weekend sampling. Each site would be dynamically updated based on other participants’ submitted BSEs (S1 Text). Associated point values could be assigned relative to the priority level, and these point values could contribute to a “leaderboard” that prescribes scores based on the value of a given BSE. See here for a dynamic version showing the change in value through time. BSE, biodiversity sampling event.
