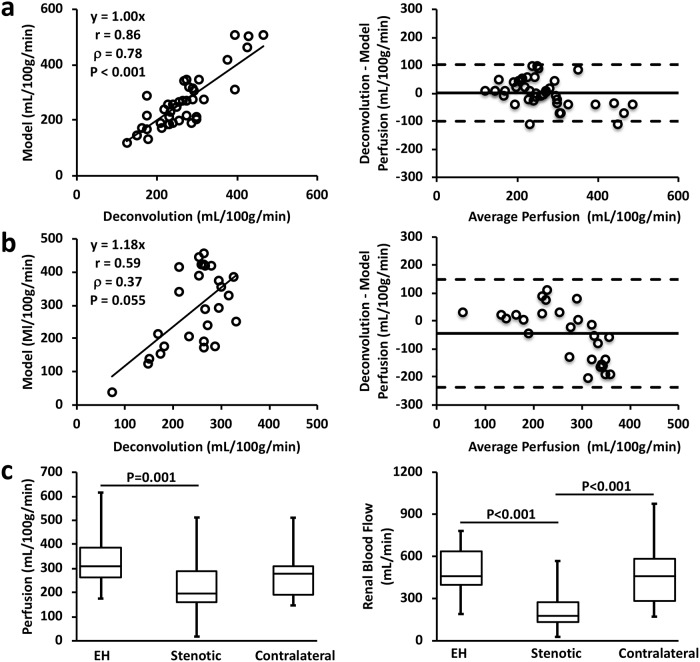
Fig 4. Renal perfusion and blood flow by DCE-CT.
(a-b) Correlation (left) and Bland-Altman (right) analyses of renal perfusion derived from the deconvolution algorithm and model fitting in kidneys with blood transit delay below (a) and above (b) 1 sec. (c) Model-derived renal perfusion (left) and calculated renal blood flow (right) in all EH, stenotic, and contralateral kidneys.

