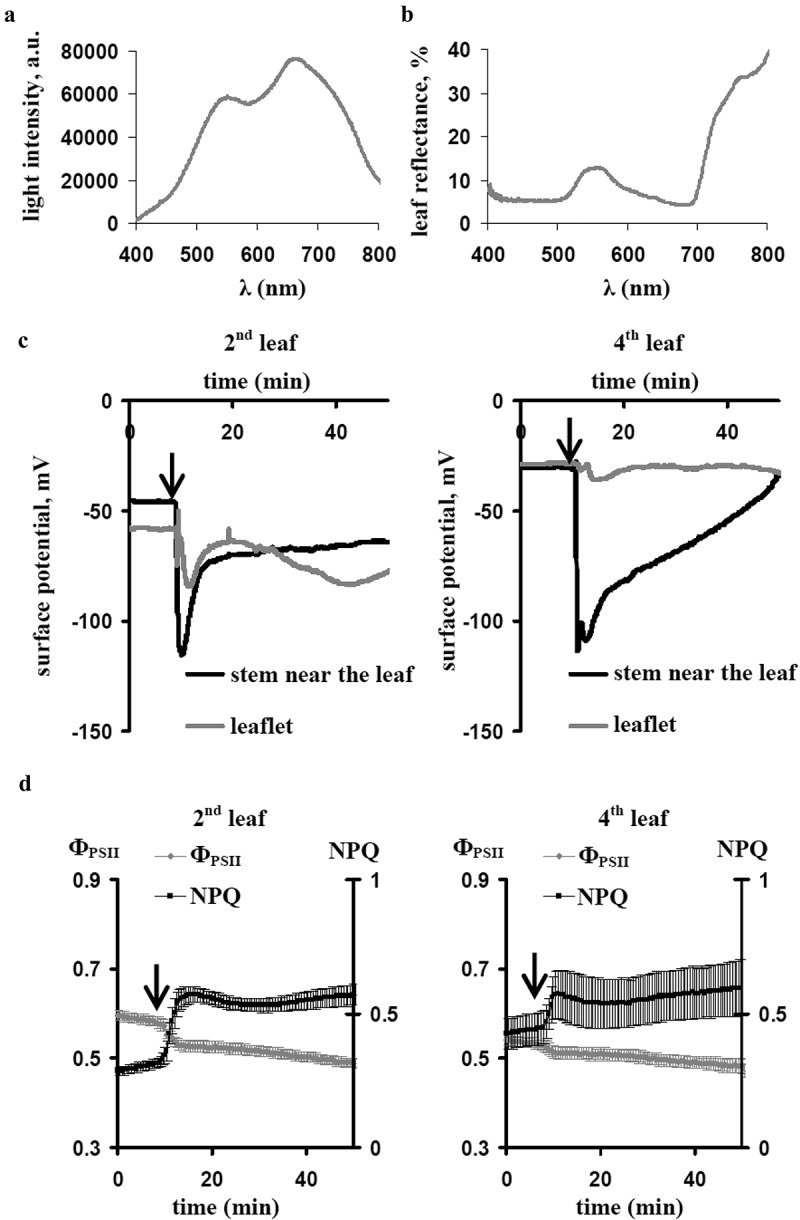
Figure 1.

(a). The light spectrum of the white actinic light, which was used in the current work. (b). The reflectance spectrum of the pea leaf. (c). Local burning-induced electrical signals in leaflets of the second and fourth leaves and in the stem near these leaves (n= 5). (d). Averaged dynamics of the quantum yield of photosystem II (ФPSII) and the non-photochemical quenching in chlorophyll fluorescence (NPQ) in the second and fourth leaves after local burning (n= 5). The first leaf was burned (flame, 3–4 s, approximately 1 cm2), it is marked by the arrow. The white card was used for calibration and calculation of the leaf reflectance.
