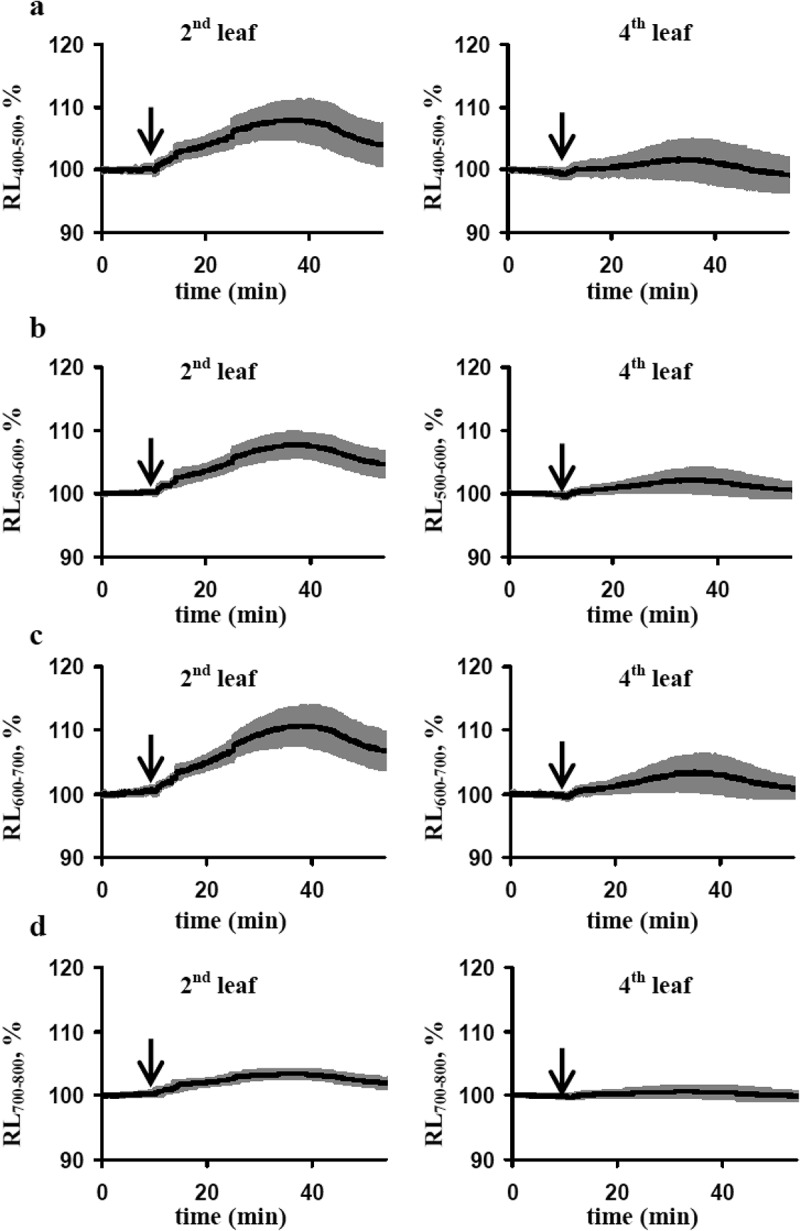
Figure 2.

Averaged dynamics of relative intensities of the reflected light (RL) at 400–500 nm (a), 500–600 nm (b), 600–700 nm (c) and 700–800 nm (d) in the second and fourth leaves after local burning (n= 5). The first leaf was burned (flame, 3–4 s, approximately 1 cm2), it is marked by the arrow. The intensity of the reflected light before burning was assumed as 100%. Averaged values are shown as black bold lines; the grey shadows mark standard errors of these values.
