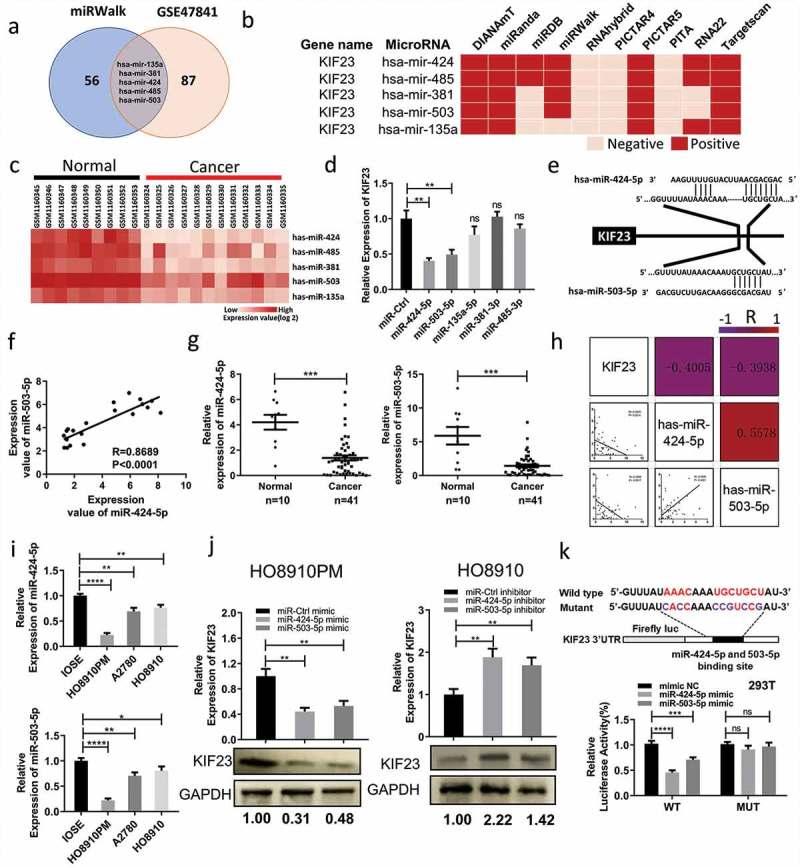
Figure 4.

KIF23 is directly targeted by miR-424-5p and miR-503-5p in vitro.
A: Venn diagram displayed intersection of miRNAs computationally that predicted to target KIF23 by mirwalk and 92 down-regulated microRNAs from the GSE47841 cohort profile data; B: The five candidates were computationally predicted to target KIF23 by mirwalk; This software program incorporates the following online tools: DIANAmT, PicTar4, PicTar5, miRanda, miRWalk, miRDB, RNAhybrid, RNA22, PITA and TargetScan. The candidates could be predicted by at least five or more online tools mentioned above were chose for further study; C: The expression levels of five candidates in normal ovarian tissues and ovarian cancer tissues from the GSE47841 cohort profile data; D: HO8910PM cells were transfected with five candidate microRNAs mimics or miR-Ctrl mimic and KIF23 mRNA levels were analyzed after 48 h; E: Schematic of predicted miR-424-5p and miR-503-5p binding sites on the 3ʹ-UTR of KIF23; F: The expression of miR-424-5p mRNA is positively correlated with the expression of miR-503-5p mRNA in normal ovarian tissues and ovarian cancer tissues from the GSE47841 cohort profile data (R = 0.8689, P < 0.001); G: The expression of miR-424-5p and miR-503-5p were significantly down-regulated in 41 ovarian cancer tissues, compared with normal (***p < 0.001); H: The correlation coefficient heatmap for miR-424-5p, miR-503-5p and KIF23 in normal ovarian tissues (n = 10) and ovarian cancer tissues (n = 41). The upper triangular part of heatmap indicated raw correlation coefficient which represented by the number in box and color of the box. The lower triangular part is the scatter plots of miR-424-5p, miR-503-5p and KIF23. MiR-424-5p and miR-503-5p were obviously positively correlated with each other (R = 0.5578, P < 0.001). KIF23 was negatively correlated with miR-424-5p (R = -0.4405, P = 0.0014) and miR-503-5p (R = -0.3938, P = 0.0017); I: The expression levels of miR-424-5p (top part) and miR-503-5p (bottom part) in ovarian epithelial normal cell line and ovarian cancer cell lines; J: HO8910PM cells were transfected with mimics or miR-Ctrl mimic and HO8910 cells were transfected with inhibitors or miR-Ctrl inhibit, the mRNA and protein levels of KIF23 were analyzed after 48 h; K: Schematic of luciferase reporter constructs with the wild-type or mutated (altered residues in purple) KIF23 3ʹ untranslated region (3ʹUTR) downstream of the Firefly luciferase reporter gene (top panel). Luciferase activity was assayed and calculated by the ratio of firefly/Renilla luciferase activity (bottom panel). (Data were shown by mean ± SEM from three independent experiments. R: Pearson Correlation Coefficient; *P < 0.05; **P < 0.01; ***P < 0.001; ****P < 0.0001, as compared to control groups).
