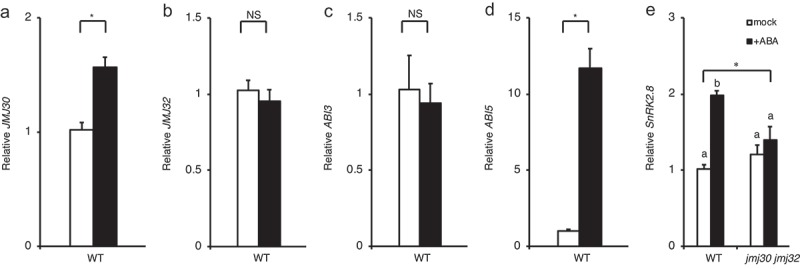
Figure 3.

JMJ30 and SnRK2.8 expression is induced by ABA. (A–D) Expression of JMJ30 (A), JMJ32 (B), ABI3 (C), and ABI5 (D) in wild-type (WT) plants in response to 10 µM ABA. Results are from three independent experiments. Values represent mean ± SEM. Asterisks indicate significant differences based on two-tailed Student’s t-test; p < .01; NS, nonsignificant. (E) Expression of SnRK2.8 in wild-type and jmj30-2 jmj32-1 plants in response to 10 µM ABA. Results are from three independent experiments. Values represent mean ± SEM. Asterisk indicates significant differences based on one-way ANOVA test; p < .01. Different letters indicate significant differences based on post-hoc Tukey’s HSD test; p < .01.
