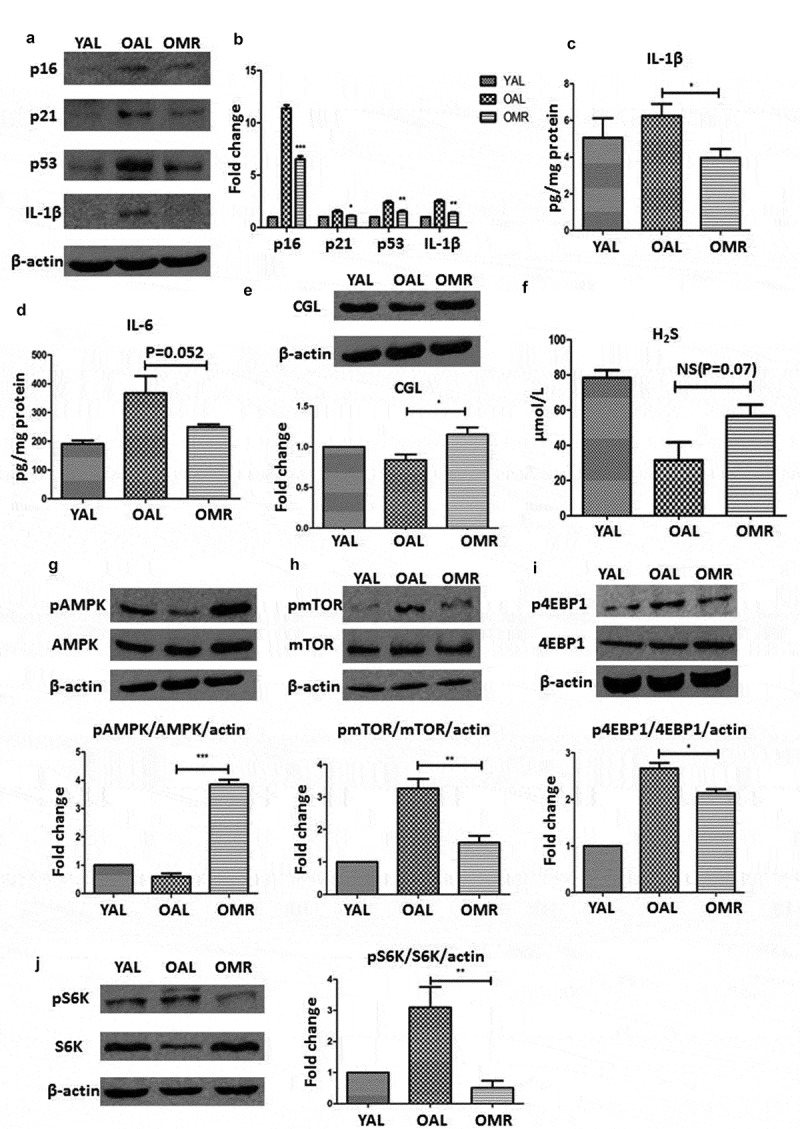
Figure 3.

MR slows senescence and suppresses the SASP in the kidneys through TSP and AMPK/mTOR. (a and b) Levels of senescence markers p16, p53, p21 and IL-1β in the young group (3-month-old), control group (OAL), and diet group (OMR). (c and d) Levels of IL-1β and IL-6 in the kidneys in the young group (3-month-old), control group (OAL), and diet group (OMR). (magnification ×40) (e and f) MR increases the TSP key enzyme CGL and H2S levels. (e) Levels of the TSP key enzyme CGL in the kidneys in the young group (3-month-old), control group (OAL), and diet group (OMR). (f) Concentrations of H2S in the serum in the young group (3-month-old), control group (OAL), and diet group (OMR). *P < 0.05. (g-i) MR increases phospho-AMPK and attenuates phosphor-mTOR levels. (G) Levels of phospho-AMPK in the kidneys in the young group (3-month-old), control group (OAL), and diet group (OMR). (h-j) Levels of phospho-mTOR and its downstream target phospho-4EBP1 and phosphor-S6K in the kidneys. Three replicates were used for western blot quantification. Values are presented as means ± SD. *P < 0.05, **P < 0.01, ***P < 0.001 versus OAL. NS, not significant. (n = 6–8).
