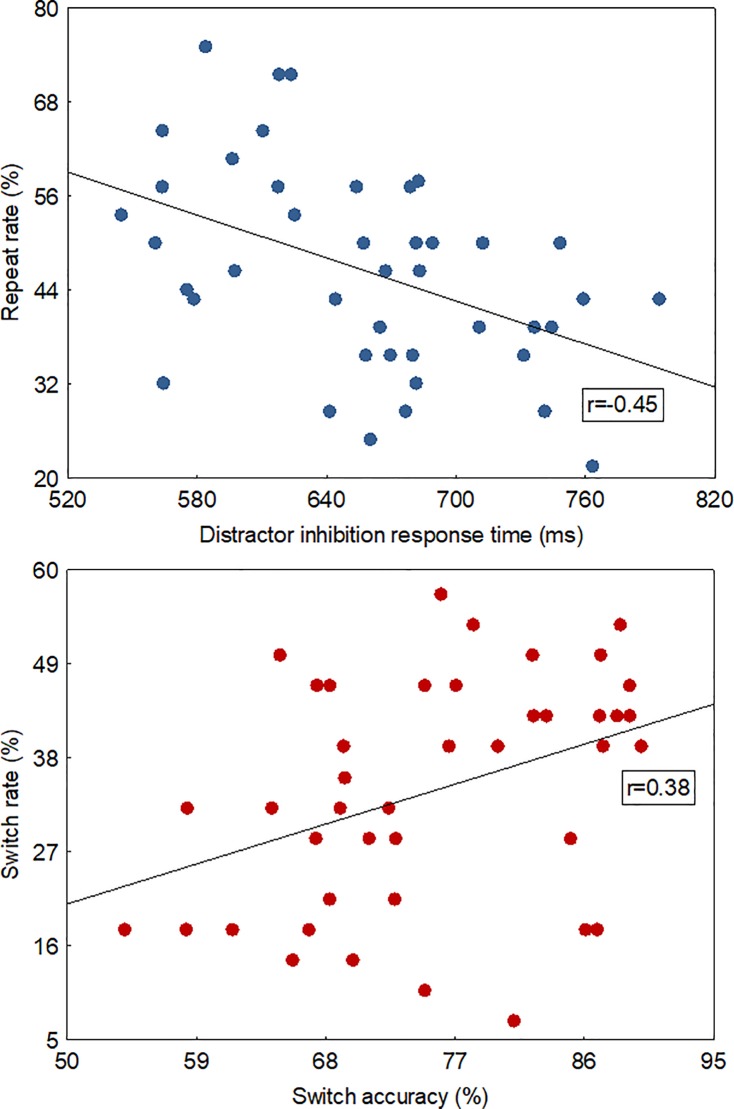
Fig 5.
(top) A scatter plot between the voluntary repeat rate (46±2%) and instructed distractor inhibition response time across handedness groups. It shows that higher repeat rates in the voluntary task associated with faster cued inhibition response times.lower) A scatter plot between the voluntary switch rate (34.±2%) and instructed switch accuracy (combined for hand and task switches) across handedness groups. It depicts that higher switch rates in the voluntary task associated with higher cued switching accuracy.

