
Figure 3.
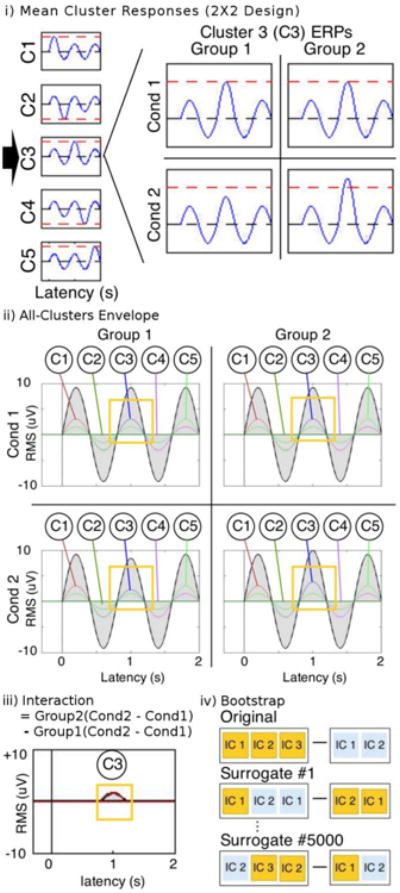
STUDY design and std_envtopo for simulated data. i) Mean cluster responses. The mean response of each cluster is a 1.25Hz sine wave with amplitude of 1, except for a specified half cycle where the amplitude is doubled. Clusters 1, 2, 4, and 5 are composed of identical ERPs in all four group-condition combinations, but Cluster 3 is composed of differing ERPs: for Condition2, the maximum amplitude is smaller in Group1 and larger in Group2. ii) Envelope plots for all group-condition combinations. The golden boxes highlight the latencies for which Cluster 3 is different. iii) Interaction envelope plot showing the difference of differences. The golden box highlights the expected contribution from Cluster 3. iv) Schematic of surrogate data generation in bootstrapping. Difference in background colours represent a difference in one STUDY variable. Note that ICs are chosen with replacement by definition of bootstrapping.