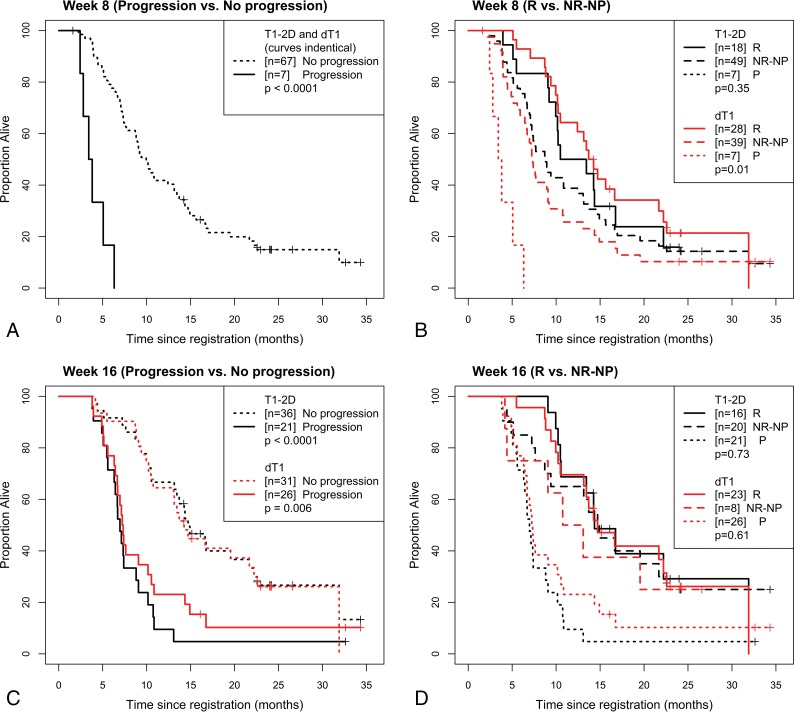
Fig 3.
Kaplan-Meier curves for 2D-T1 and dT1-determined enhancing tumor. Shown are overall survival curves stratified by whether the participant progressed at or before week 8 (A), progressed at or before week 8, broken into progressing (P), responding, and nonresponding/nonprogressing (B), progressed at or before week 16 (C) and had progressed at or before week 16, broken into P, R, and NR-NP (D).

