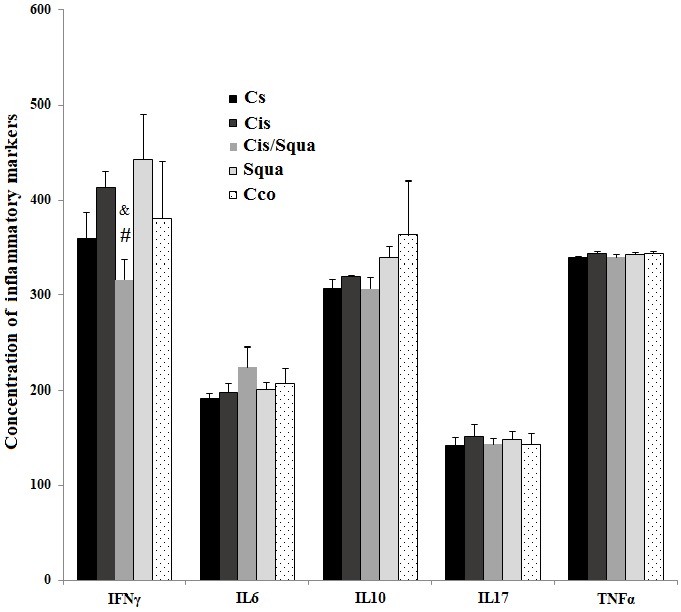
Figure 3.

The concentrations of selected inflammatory markers (IFNγ, IL6, IL10, IL17, and TNF-α) in the kidney tissue homogenates which were measured using Magpix Luminex System in Cs (control-received saline), Cis (cisplatin-treated), Cis/Squa (cisplatin and squalene cotreated), Squa (Squalene-treated), and Cco (control receiving corn oil) groups. (#) indicates the comparison with the Cis (cisplatin-treated) group, (&) indicates the comparison with the Squa (squalene-treated) group. For statistical significance, P ≤ 0.05.
